Immigrants from Croatia vs Central American 4 or more Vehicles in Household
COMPARE
Immigrants from Croatia
Central American
4 or more Vehicles in Household
4 or more Vehicles in Household Comparison
Immigrants from Croatia
Central Americans
5.4%
4 OR MORE VEHICLES IN HOUSEHOLD
0.2/ 100
METRIC RATING
287th/ 347
METRIC RANK
7.1%
4 OR MORE VEHICLES IN HOUSEHOLD
99.3/ 100
METRIC RATING
96th/ 347
METRIC RANK
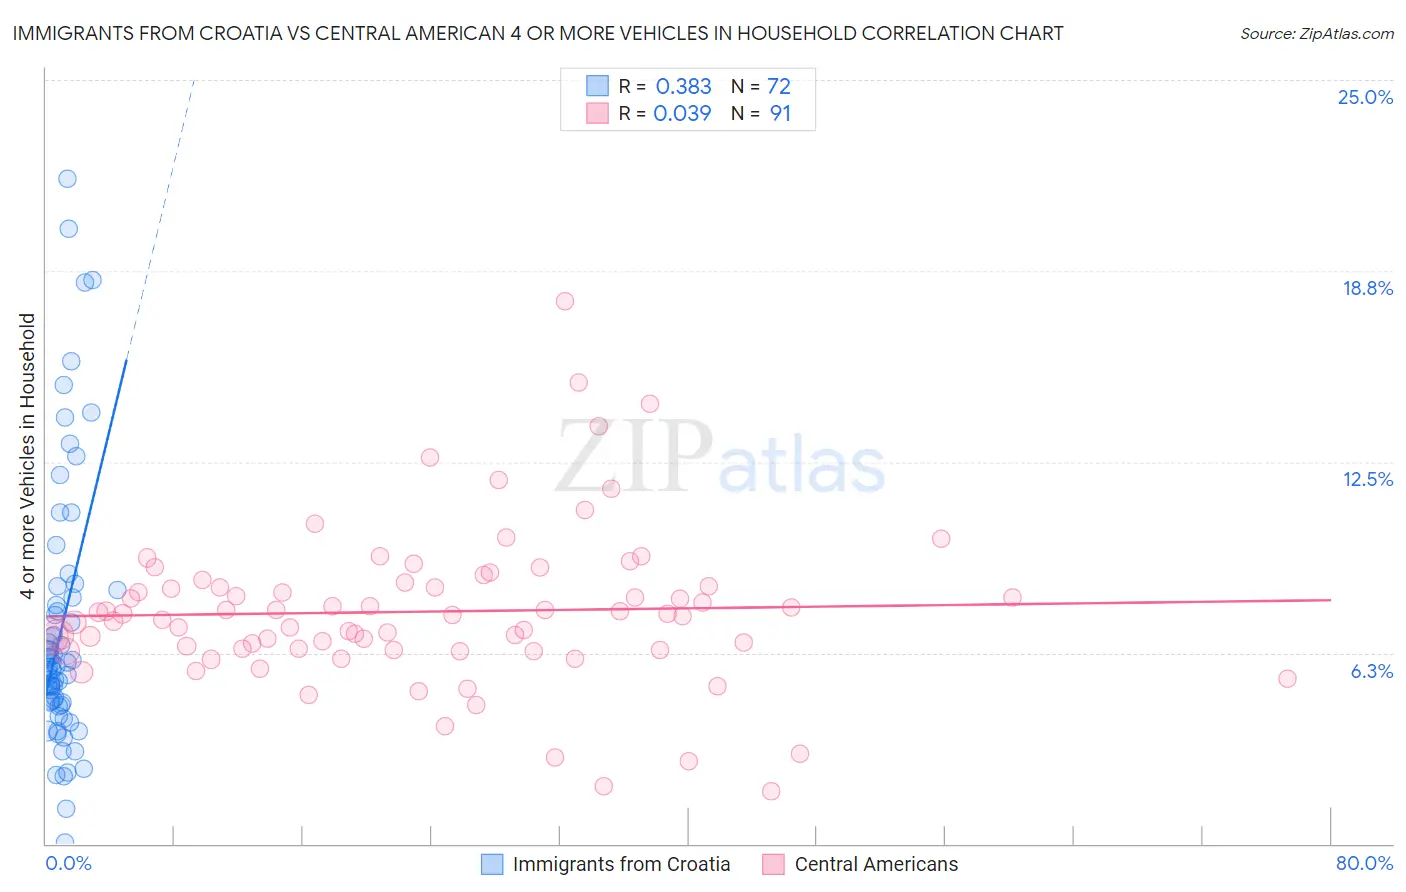
Immigrants from Croatia vs Central American 4 or more Vehicles in Household Correlation Chart
The statistical analysis conducted on geographies consisting of 131,979,110 people shows a mild positive correlation between the proportion of Immigrants from Croatia and percentage of households with 4 or more vehicles available in the United States with a correlation coefficient (R) of 0.383 and weighted average of 5.4%. Similarly, the statistical analysis conducted on geographies consisting of 501,959,765 people shows no correlation between the proportion of Central Americans and percentage of households with 4 or more vehicles available in the United States with a correlation coefficient (R) of 0.039 and weighted average of 7.1%, a difference of 32.9%.
4 or more Vehicles in Household Correlation Summary
| Measurement | Immigrants from Croatia | Central American |
| Minimum | 0.039% | 1.7% |
| Maximum | 21.8% | 17.7% |
| Range | 21.7% | 16.0% |
| Mean | 7.1% | 7.6% |
| Median | 5.8% | 7.5% |
| Interquartile 25% (IQ1) | 4.6% | 6.3% |
| Interquartile 75% (IQ3) | 8.2% | 8.4% |
| Interquartile Range (IQR) | 3.6% | 2.1% |
| Standard Deviation (Sample) | 4.4% | 2.6% |
| Standard Deviation (Population) | 4.4% | 2.6% |
Similar Demographics by 4 or more Vehicles in Household
Demographics Similar to Immigrants from Croatia by 4 or more Vehicles in Household
In terms of 4 or more vehicles in household, the demographic groups most similar to Immigrants from Croatia are Immigrants from Colombia (5.4%, a difference of 0.10%), Immigrants from Liberia (5.4%, a difference of 0.13%), Venezuelan (5.3%, a difference of 0.19%), Immigrants from Bosnia and Herzegovina (5.3%, a difference of 0.33%), and Brazilian (5.4%, a difference of 0.47%).
| Demographics | Rating | Rank | 4 or more Vehicles in Household |
| Alsatians | 0.3 /100 | #280 | Tragic 5.4% |
| Immigrants | Western Africa | 0.3 /100 | #281 | Tragic 5.4% |
| Immigrants | Spain | 0.3 /100 | #282 | Tragic 5.4% |
| Immigrants | Ireland | 0.3 /100 | #283 | Tragic 5.4% |
| Brazilians | 0.3 /100 | #284 | Tragic 5.4% |
| Immigrants | Liberia | 0.2 /100 | #285 | Tragic 5.4% |
| Immigrants | Colombia | 0.2 /100 | #286 | Tragic 5.4% |
| Immigrants | Croatia | 0.2 /100 | #287 | Tragic 5.4% |
| Venezuelans | 0.2 /100 | #288 | Tragic 5.3% |
| Immigrants | Bosnia and Herzegovina | 0.2 /100 | #289 | Tragic 5.3% |
| Immigrants | Russia | 0.2 /100 | #290 | Tragic 5.3% |
| Immigrants | Bahamas | 0.1 /100 | #291 | Tragic 5.3% |
| Liberians | 0.1 /100 | #292 | Tragic 5.3% |
| Immigrants | Congo | 0.1 /100 | #293 | Tragic 5.2% |
| Ghanaians | 0.1 /100 | #294 | Tragic 5.2% |
Demographics Similar to Central Americans by 4 or more Vehicles in Household
In terms of 4 or more vehicles in household, the demographic groups most similar to Central Americans are Czechoslovakian (7.1%, a difference of 0.010%), Immigrants from Afghanistan (7.1%, a difference of 0.23%), Dutch West Indian (7.1%, a difference of 0.23%), Celtic (7.1%, a difference of 0.35%), and Immigrants from Latin America (7.1%, a difference of 0.41%).
| Demographics | Rating | Rank | 4 or more Vehicles in Household |
| British | 99.6 /100 | #89 | Exceptional 7.2% |
| Creek | 99.6 /100 | #90 | Exceptional 7.2% |
| Assyrians/Chaldeans/Syriacs | 99.4 /100 | #91 | Exceptional 7.2% |
| Immigrants | Latin America | 99.4 /100 | #92 | Exceptional 7.1% |
| Immigrants | Afghanistan | 99.3 /100 | #93 | Exceptional 7.1% |
| Dutch West Indians | 99.3 /100 | #94 | Exceptional 7.1% |
| Czechoslovakians | 99.3 /100 | #95 | Exceptional 7.1% |
| Central Americans | 99.3 /100 | #96 | Exceptional 7.1% |
| Celtics | 99.1 /100 | #97 | Exceptional 7.1% |
| Irish | 99.0 /100 | #98 | Exceptional 7.1% |
| Seminole | 98.8 /100 | #99 | Exceptional 7.0% |
| Taiwanese | 98.7 /100 | #100 | Exceptional 7.0% |
| Pakistanis | 98.7 /100 | #101 | Exceptional 7.0% |
| Asians | 98.6 /100 | #102 | Exceptional 7.0% |
| Blackfeet | 98.6 /100 | #103 | Exceptional 7.0% |