Bahamian vs Central American 4 or more Vehicles in Household
COMPARE
Bahamian
Central American
4 or more Vehicles in Household
4 or more Vehicles in Household Comparison
Bahamians
Central Americans
5.1%
4 OR MORE VEHICLES IN HOUSEHOLD
0.0/ 100
METRIC RATING
302nd/ 347
METRIC RANK
7.1%
4 OR MORE VEHICLES IN HOUSEHOLD
99.3/ 100
METRIC RATING
96th/ 347
METRIC RANK
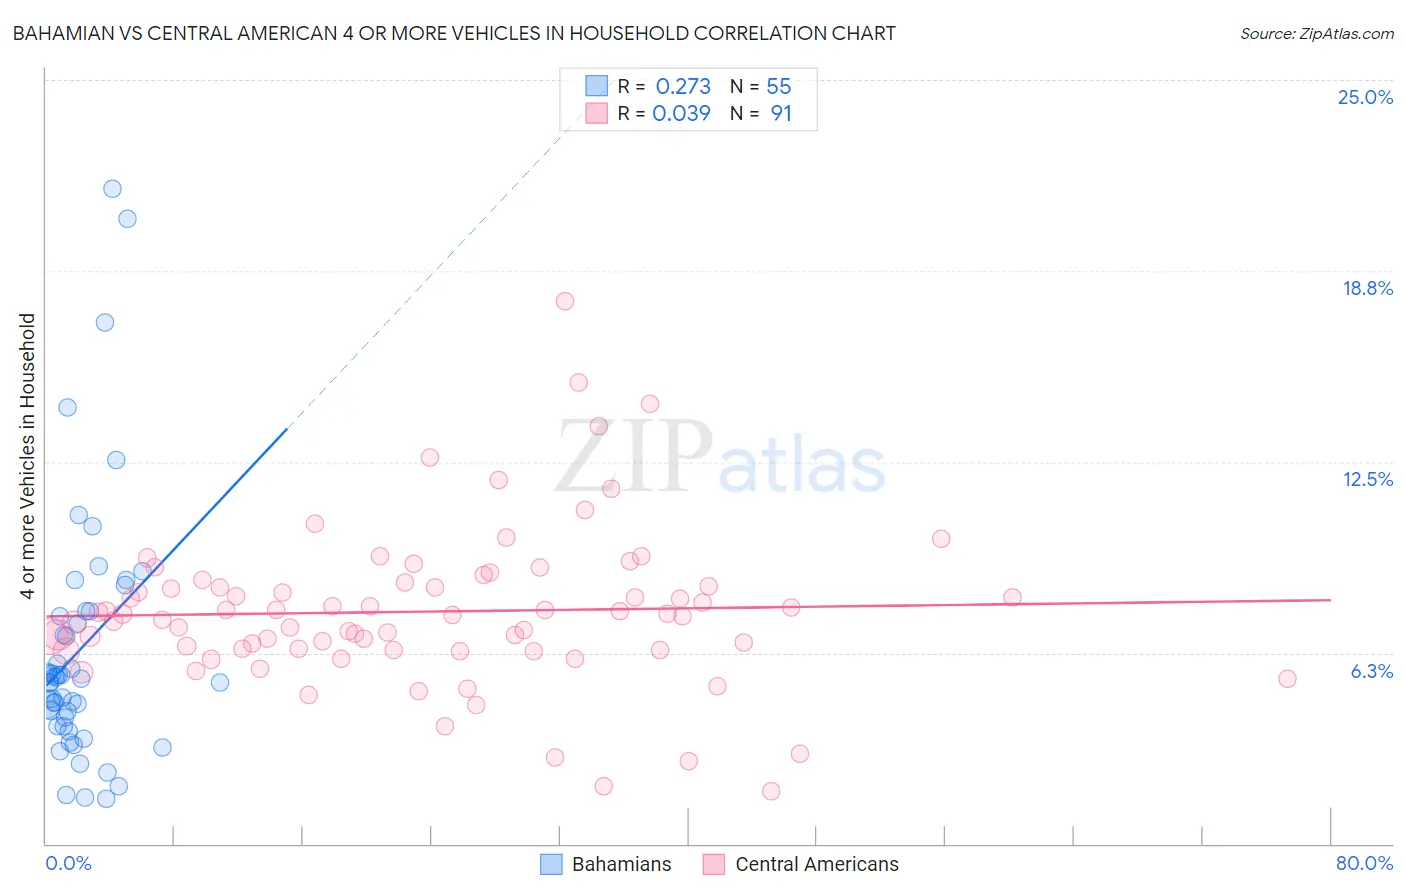
Bahamian vs Central American 4 or more Vehicles in Household Correlation Chart
The statistical analysis conducted on geographies consisting of 112,347,492 people shows a weak positive correlation between the proportion of Bahamians and percentage of households with 4 or more vehicles available in the United States with a correlation coefficient (R) of 0.273 and weighted average of 5.1%. Similarly, the statistical analysis conducted on geographies consisting of 501,959,765 people shows no correlation between the proportion of Central Americans and percentage of households with 4 or more vehicles available in the United States with a correlation coefficient (R) of 0.039 and weighted average of 7.1%, a difference of 40.1%.
4 or more Vehicles in Household Correlation Summary
| Measurement | Bahamian | Central American |
| Minimum | 1.5% | 1.7% |
| Maximum | 21.5% | 17.7% |
| Range | 20.0% | 16.0% |
| Mean | 6.4% | 7.6% |
| Median | 5.4% | 7.5% |
| Interquartile 25% (IQ1) | 3.9% | 6.3% |
| Interquartile 75% (IQ3) | 7.6% | 8.4% |
| Interquartile Range (IQR) | 3.7% | 2.1% |
| Standard Deviation (Sample) | 4.2% | 2.6% |
| Standard Deviation (Population) | 4.1% | 2.6% |
Similar Demographics by 4 or more Vehicles in Household
Demographics Similar to Bahamians by 4 or more Vehicles in Household
In terms of 4 or more vehicles in household, the demographic groups most similar to Bahamians are Immigrants from Zaire (5.1%, a difference of 0.31%), Immigrants from Morocco (5.1%, a difference of 0.39%), Immigrants from Greece (5.1%, a difference of 0.47%), Cypriot (5.0%, a difference of 1.0%), and Somali (5.0%, a difference of 1.0%).
| Demographics | Rating | Rank | 4 or more Vehicles in Household |
| Immigrants | Brazil | 0.1 /100 | #295 | Tragic 5.2% |
| Israelis | 0.1 /100 | #296 | Tragic 5.2% |
| Immigrants | Venezuela | 0.1 /100 | #297 | Tragic 5.2% |
| Immigrants | South America | 0.1 /100 | #298 | Tragic 5.2% |
| Immigrants | Ghana | 0.1 /100 | #299 | Tragic 5.2% |
| Immigrants | Morocco | 0.0 /100 | #300 | Tragic 5.1% |
| Immigrants | Zaire | 0.0 /100 | #301 | Tragic 5.1% |
| Bahamians | 0.0 /100 | #302 | Tragic 5.1% |
| Immigrants | Greece | 0.0 /100 | #303 | Tragic 5.1% |
| Cypriots | 0.0 /100 | #304 | Tragic 5.0% |
| Somalis | 0.0 /100 | #305 | Tragic 5.0% |
| Immigrants | Serbia | 0.0 /100 | #306 | Tragic 5.0% |
| Menominee | 0.0 /100 | #307 | Tragic 5.0% |
| Paraguayans | 0.0 /100 | #308 | Tragic 4.9% |
| Immigrants | Somalia | 0.0 /100 | #309 | Tragic 4.9% |
Demographics Similar to Central Americans by 4 or more Vehicles in Household
In terms of 4 or more vehicles in household, the demographic groups most similar to Central Americans are Czechoslovakian (7.1%, a difference of 0.010%), Immigrants from Afghanistan (7.1%, a difference of 0.23%), Dutch West Indian (7.1%, a difference of 0.23%), Celtic (7.1%, a difference of 0.35%), and Immigrants from Latin America (7.1%, a difference of 0.41%).
| Demographics | Rating | Rank | 4 or more Vehicles in Household |
| British | 99.6 /100 | #89 | Exceptional 7.2% |
| Creek | 99.6 /100 | #90 | Exceptional 7.2% |
| Assyrians/Chaldeans/Syriacs | 99.4 /100 | #91 | Exceptional 7.2% |
| Immigrants | Latin America | 99.4 /100 | #92 | Exceptional 7.1% |
| Immigrants | Afghanistan | 99.3 /100 | #93 | Exceptional 7.1% |
| Dutch West Indians | 99.3 /100 | #94 | Exceptional 7.1% |
| Czechoslovakians | 99.3 /100 | #95 | Exceptional 7.1% |
| Central Americans | 99.3 /100 | #96 | Exceptional 7.1% |
| Celtics | 99.1 /100 | #97 | Exceptional 7.1% |
| Irish | 99.0 /100 | #98 | Exceptional 7.1% |
| Seminole | 98.8 /100 | #99 | Exceptional 7.0% |
| Taiwanese | 98.7 /100 | #100 | Exceptional 7.0% |
| Pakistanis | 98.7 /100 | #101 | Exceptional 7.0% |
| Asians | 98.6 /100 | #102 | Exceptional 7.0% |
| Blackfeet | 98.6 /100 | #103 | Exceptional 7.0% |