Pima vs Finnish 4 or more Vehicles in Household
COMPARE
Pima
Finnish
4 or more Vehicles in Household
4 or more Vehicles in Household Comparison
Pima
Finns
7.9%
4 OR MORE VEHICLES IN HOUSEHOLD
100.0/ 100
METRIC RATING
41st/ 347
METRIC RANK
7.3%
4 OR MORE VEHICLES IN HOUSEHOLD
99.8/ 100
METRIC RATING
81st/ 347
METRIC RANK
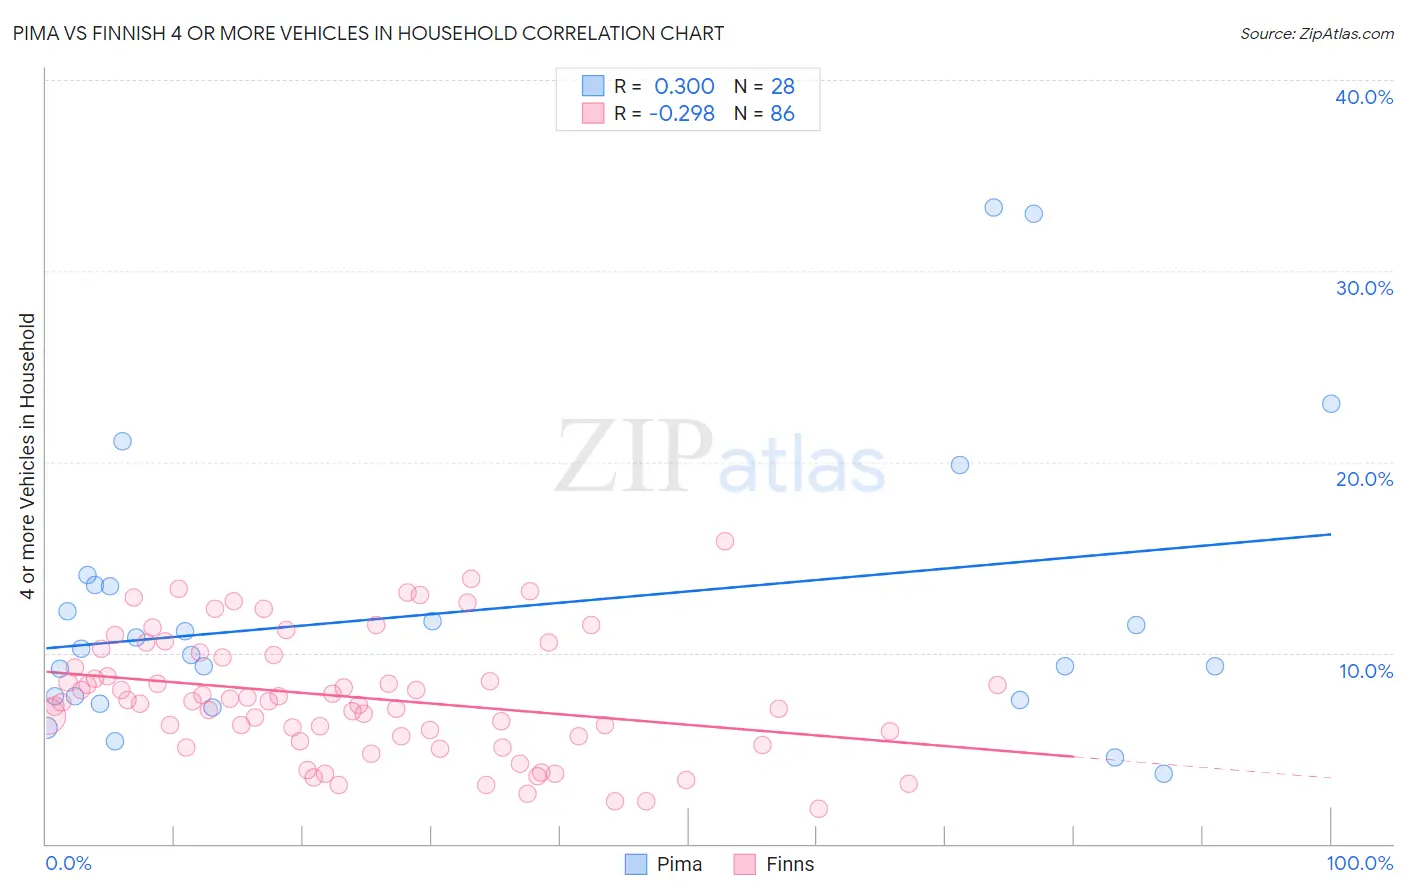
Pima vs Finnish 4 or more Vehicles in Household Correlation Chart
The statistical analysis conducted on geographies consisting of 61,524,905 people shows a weak positive correlation between the proportion of Pima and percentage of households with 4 or more vehicles available in the United States with a correlation coefficient (R) of 0.300 and weighted average of 7.9%. Similarly, the statistical analysis conducted on geographies consisting of 403,293,197 people shows a weak negative correlation between the proportion of Finns and percentage of households with 4 or more vehicles available in the United States with a correlation coefficient (R) of -0.298 and weighted average of 7.3%, a difference of 7.8%.
4 or more Vehicles in Household Correlation Summary
| Measurement | Pima | Finnish |
| Minimum | 3.7% | 1.8% |
| Maximum | 33.3% | 15.9% |
| Range | 29.7% | 14.0% |
| Mean | 12.2% | 7.7% |
| Median | 10.0% | 7.5% |
| Interquartile 25% (IQ1) | 7.6% | 5.6% |
| Interquartile 75% (IQ3) | 13.5% | 9.9% |
| Interquartile Range (IQR) | 5.9% | 4.3% |
| Standard Deviation (Sample) | 7.5% | 3.2% |
| Standard Deviation (Population) | 7.4% | 3.1% |
Similar Demographics by 4 or more Vehicles in Household
Demographics Similar to Pima by 4 or more Vehicles in Household
In terms of 4 or more vehicles in household, the demographic groups most similar to Pima are Salvadoran (7.8%, a difference of 0.49%), Spanish (7.9%, a difference of 0.57%), Fijian (7.8%, a difference of 0.60%), Bhutanese (7.8%, a difference of 0.86%), and Choctaw (7.8%, a difference of 0.92%).
| Demographics | Rating | Rank | 4 or more Vehicles in Household |
| Alaskan Athabascans | 100.0 /100 | #34 | Exceptional 8.1% |
| Guamanians/Chamorros | 100.0 /100 | #35 | Exceptional 8.1% |
| Norwegians | 100.0 /100 | #36 | Exceptional 8.0% |
| Scandinavians | 100.0 /100 | #37 | Exceptional 8.0% |
| Sioux | 100.0 /100 | #38 | Exceptional 8.0% |
| Spanish Americans | 100.0 /100 | #39 | Exceptional 8.0% |
| Spanish | 100.0 /100 | #40 | Exceptional 7.9% |
| Pima | 100.0 /100 | #41 | Exceptional 7.9% |
| Salvadorans | 100.0 /100 | #42 | Exceptional 7.8% |
| Fijians | 100.0 /100 | #43 | Exceptional 7.8% |
| Bhutanese | 100.0 /100 | #44 | Exceptional 7.8% |
| Choctaw | 100.0 /100 | #45 | Exceptional 7.8% |
| Crow | 100.0 /100 | #46 | Exceptional 7.8% |
| Osage | 100.0 /100 | #47 | Exceptional 7.8% |
| Swiss | 100.0 /100 | #48 | Exceptional 7.8% |
Demographics Similar to Finns by 4 or more Vehicles in Household
In terms of 4 or more vehicles in household, the demographic groups most similar to Finns are Northern European (7.3%, a difference of 0.20%), Potawatomi (7.3%, a difference of 0.32%), Alaska Native (7.3%, a difference of 0.56%), Afghan (7.3%, a difference of 0.65%), and Czech (7.4%, a difference of 0.70%).
| Demographics | Rating | Rank | 4 or more Vehicles in Household |
| Icelanders | 99.9 /100 | #74 | Exceptional 7.4% |
| Immigrants | Cambodia | 99.9 /100 | #75 | Exceptional 7.4% |
| Laotians | 99.9 /100 | #76 | Exceptional 7.4% |
| Apache | 99.9 /100 | #77 | Exceptional 7.4% |
| Whites/Caucasians | 99.8 /100 | #78 | Exceptional 7.4% |
| Czechs | 99.8 /100 | #79 | Exceptional 7.4% |
| Alaska Natives | 99.8 /100 | #80 | Exceptional 7.3% |
| Finns | 99.8 /100 | #81 | Exceptional 7.3% |
| Northern Europeans | 99.8 /100 | #82 | Exceptional 7.3% |
| Potawatomi | 99.7 /100 | #83 | Exceptional 7.3% |
| Afghans | 99.7 /100 | #84 | Exceptional 7.3% |
| Cree | 99.7 /100 | #85 | Exceptional 7.2% |
| Immigrants | Indonesia | 99.6 /100 | #86 | Exceptional 7.2% |
| Delaware | 99.6 /100 | #87 | Exceptional 7.2% |
| Immigrants | Nonimmigrants | 99.6 /100 | #88 | Exceptional 7.2% |