Paraguayan vs Ecuadorian Female Poverty Among 18-24 Year Olds
COMPARE
Paraguayan
Ecuadorian
Female Poverty Among 18-24 Year Olds
Female Poverty Among 18-24 Year Olds Comparison
Paraguayans
Ecuadorians
19.4%
FEMALE POVERTY AMONG 18-24 YEAR OLDS
94.6/ 100
METRIC RATING
123rd/ 347
METRIC RANK
19.1%
FEMALE POVERTY AMONG 18-24 YEAR OLDS
98.1/ 100
METRIC RATING
101st/ 347
METRIC RANK
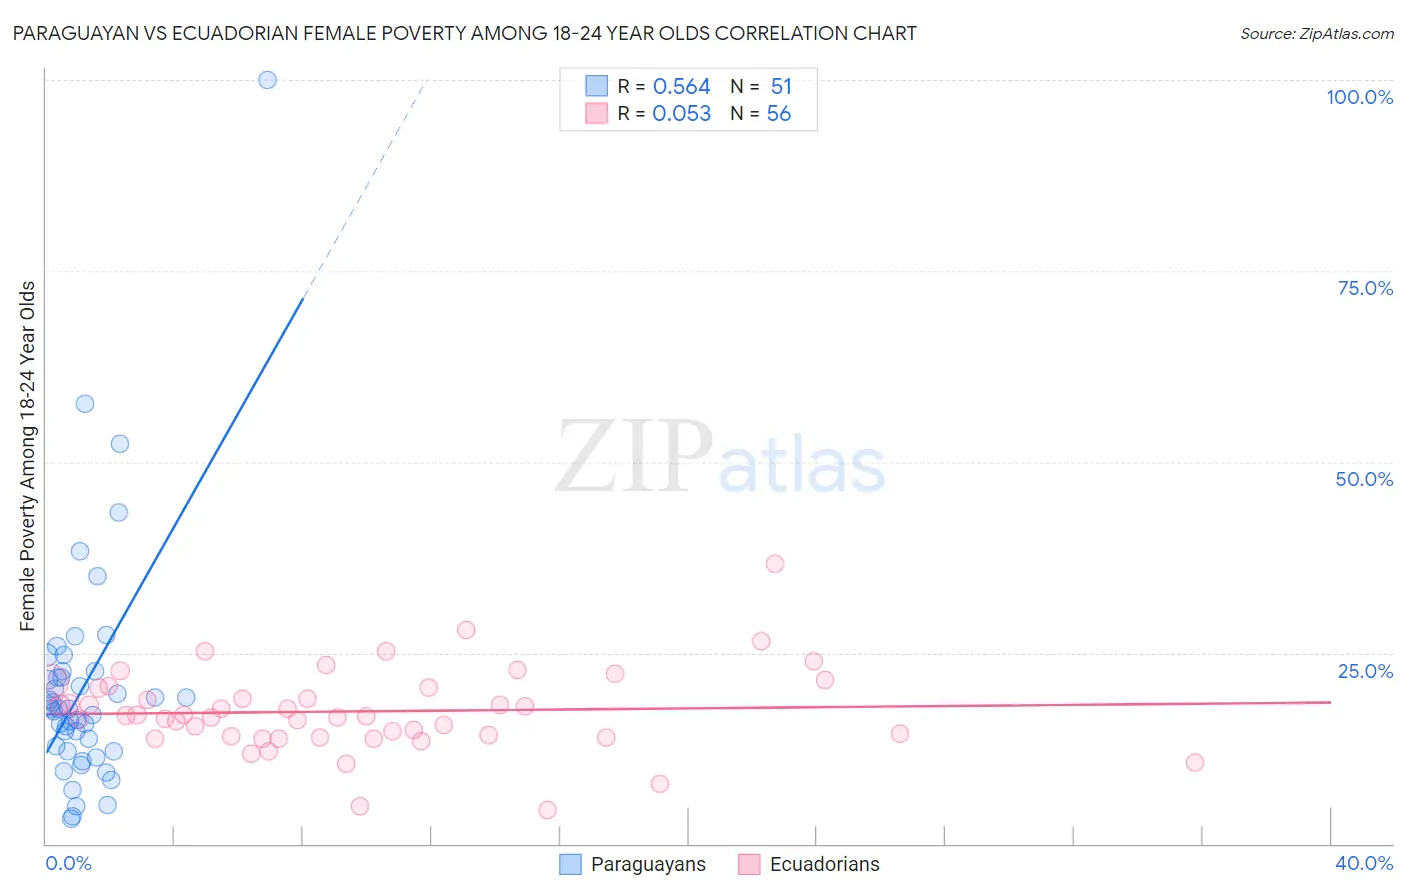
Paraguayan vs Ecuadorian Female Poverty Among 18-24 Year Olds Correlation Chart
The statistical analysis conducted on geographies consisting of 94,427,228 people shows a substantial positive correlation between the proportion of Paraguayans and poverty level among females between the ages 18 and 24 in the United States with a correlation coefficient (R) of 0.564 and weighted average of 19.4%. Similarly, the statistical analysis conducted on geographies consisting of 311,495,994 people shows a slight positive correlation between the proportion of Ecuadorians and poverty level among females between the ages 18 and 24 in the United States with a correlation coefficient (R) of 0.053 and weighted average of 19.1%, a difference of 1.4%.
Female Poverty Among 18-24 Year Olds Correlation Summary
| Measurement | Paraguayan | Ecuadorian |
| Minimum | 3.3% | 4.4% |
| Maximum | 100.0% | 36.6% |
| Range | 96.7% | 32.2% |
| Mean | 20.6% | 17.3% |
| Median | 17.7% | 16.7% |
| Interquartile 25% (IQ1) | 12.2% | 14.0% |
| Interquartile 75% (IQ3) | 22.5% | 20.4% |
| Interquartile Range (IQR) | 10.4% | 6.4% |
| Standard Deviation (Sample) | 15.7% | 5.4% |
| Standard Deviation (Population) | 15.6% | 5.4% |
Similar Demographics by Female Poverty Among 18-24 Year Olds
Demographics Similar to Paraguayans by Female Poverty Among 18-24 Year Olds
In terms of female poverty among 18-24 year olds, the demographic groups most similar to Paraguayans are Cambodian (19.4%, a difference of 0.010%), Immigrants from Chile (19.4%, a difference of 0.070%), Immigrants from Panama (19.4%, a difference of 0.13%), Guyanese (19.4%, a difference of 0.20%), and Immigrants from Russia (19.4%, a difference of 0.20%).
| Demographics | Rating | Rank | Female Poverty Among 18-24 Year Olds |
| Immigrants | Immigrants | 95.9 /100 | #116 | Exceptional 19.3% |
| Immigrants | Iran | 95.8 /100 | #117 | Exceptional 19.3% |
| Immigrants | Guyana | 95.6 /100 | #118 | Exceptional 19.3% |
| Cypriots | 95.5 /100 | #119 | Exceptional 19.3% |
| Immigrants | Northern Europe | 95.4 /100 | #120 | Exceptional 19.4% |
| Guyanese | 95.3 /100 | #121 | Exceptional 19.4% |
| Cambodians | 94.6 /100 | #122 | Exceptional 19.4% |
| Paraguayans | 94.6 /100 | #123 | Exceptional 19.4% |
| Immigrants | Chile | 94.3 /100 | #124 | Exceptional 19.4% |
| Immigrants | Panama | 94.0 /100 | #125 | Exceptional 19.4% |
| Immigrants | Russia | 93.7 /100 | #126 | Exceptional 19.4% |
| Cape Verdeans | 93.6 /100 | #127 | Exceptional 19.4% |
| Slovaks | 92.9 /100 | #128 | Exceptional 19.5% |
| Immigrants | England | 92.9 /100 | #129 | Exceptional 19.5% |
| Immigrants | Canada | 92.9 /100 | #130 | Exceptional 19.5% |
Demographics Similar to Ecuadorians by Female Poverty Among 18-24 Year Olds
In terms of female poverty among 18-24 year olds, the demographic groups most similar to Ecuadorians are Immigrants from Caribbean (19.1%, a difference of 0.020%), Serbian (19.1%, a difference of 0.070%), Chilean (19.1%, a difference of 0.090%), Immigrants from Czechoslovakia (19.1%, a difference of 0.11%), and Immigrants from Afghanistan (19.1%, a difference of 0.11%).
| Demographics | Rating | Rank | Female Poverty Among 18-24 Year Olds |
| Ukrainians | 98.8 /100 | #94 | Exceptional 19.0% |
| Guamanians/Chamorros | 98.8 /100 | #95 | Exceptional 19.0% |
| Sierra Leoneans | 98.7 /100 | #96 | Exceptional 19.0% |
| Salvadorans | 98.4 /100 | #97 | Exceptional 19.1% |
| Immigrants | Jordan | 98.4 /100 | #98 | Exceptional 19.1% |
| Immigrants | Czechoslovakia | 98.3 /100 | #99 | Exceptional 19.1% |
| Chileans | 98.3 /100 | #100 | Exceptional 19.1% |
| Ecuadorians | 98.1 /100 | #101 | Exceptional 19.1% |
| Immigrants | Caribbean | 98.1 /100 | #102 | Exceptional 19.1% |
| Serbians | 98.0 /100 | #103 | Exceptional 19.1% |
| Immigrants | Afghanistan | 98.0 /100 | #104 | Exceptional 19.1% |
| Immigrants | Ecuador | 97.8 /100 | #105 | Exceptional 19.2% |
| Immigrants | Sierra Leone | 97.8 /100 | #106 | Exceptional 19.2% |
| Immigrants | Sri Lanka | 97.5 /100 | #107 | Exceptional 19.2% |
| Immigrants | Uzbekistan | 97.3 /100 | #108 | Exceptional 19.2% |