Immigrants from Albania vs Native/Alaskan 4 or more Vehicles in Household
COMPARE
Immigrants from Albania
Native/Alaskan
4 or more Vehicles in Household
4 or more Vehicles in Household Comparison
Immigrants from Albania
Natives/Alaskans
4.1%
4 OR MORE VEHICLES IN HOUSEHOLD
0.0/ 100
METRIC RATING
333rd/ 347
METRIC RANK
8.2%
4 OR MORE VEHICLES IN HOUSEHOLD
100.0/ 100
METRIC RATING
31st/ 347
METRIC RANK
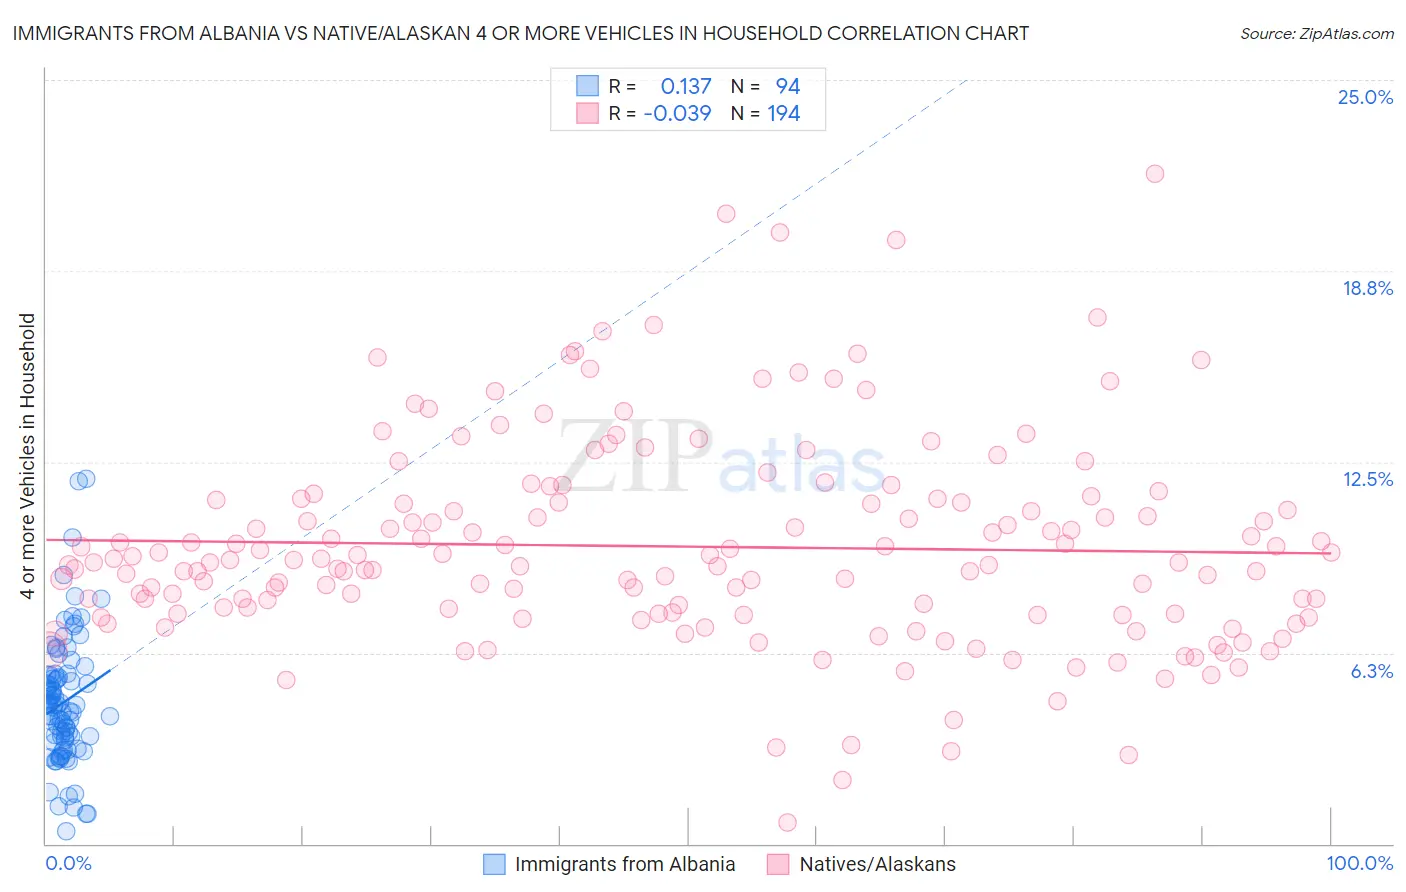
Immigrants from Albania vs Native/Alaskan 4 or more Vehicles in Household Correlation Chart
The statistical analysis conducted on geographies consisting of 118,698,484 people shows a poor positive correlation between the proportion of Immigrants from Albania and percentage of households with 4 or more vehicles available in the United States with a correlation coefficient (R) of 0.137 and weighted average of 4.1%. Similarly, the statistical analysis conducted on geographies consisting of 510,504,827 people shows no correlation between the proportion of Natives/Alaskans and percentage of households with 4 or more vehicles available in the United States with a correlation coefficient (R) of -0.039 and weighted average of 8.2%, a difference of 99.0%.
4 or more Vehicles in Household Correlation Summary
| Measurement | Immigrants from Albania | Native/Alaskan |
| Minimum | 0.42% | 0.68% |
| Maximum | 12.0% | 21.9% |
| Range | 11.5% | 21.2% |
| Mean | 4.6% | 9.7% |
| Median | 4.5% | 9.2% |
| Interquartile 25% (IQ1) | 3.4% | 7.5% |
| Interquartile 75% (IQ3) | 5.5% | 11.3% |
| Interquartile Range (IQR) | 2.1% | 3.7% |
| Standard Deviation (Sample) | 2.1% | 3.4% |
| Standard Deviation (Population) | 2.1% | 3.4% |
Similar Demographics by 4 or more Vehicles in Household
Demographics Similar to Immigrants from Albania by 4 or more Vehicles in Household
In terms of 4 or more vehicles in household, the demographic groups most similar to Immigrants from Albania are Immigrants from Trinidad and Tobago (4.1%, a difference of 0.21%), Immigrants from Dominica (4.2%, a difference of 1.7%), West Indian (4.2%, a difference of 2.6%), Immigrants from Ecuador (4.2%, a difference of 2.9%), and Immigrants from Senegal (4.2%, a difference of 3.1%).
| Demographics | Rating | Rank | 4 or more Vehicles in Household |
| Cape Verdeans | 0.0 /100 | #326 | Tragic 4.4% |
| Senegalese | 0.0 /100 | #327 | Tragic 4.3% |
| Trinidadians and Tobagonians | 0.0 /100 | #328 | Tragic 4.3% |
| Immigrants | Senegal | 0.0 /100 | #329 | Tragic 4.2% |
| Immigrants | Ecuador | 0.0 /100 | #330 | Tragic 4.2% |
| West Indians | 0.0 /100 | #331 | Tragic 4.2% |
| Immigrants | Dominica | 0.0 /100 | #332 | Tragic 4.2% |
| Immigrants | Albania | 0.0 /100 | #333 | Tragic 4.1% |
| Immigrants | Trinidad and Tobago | 0.0 /100 | #334 | Tragic 4.1% |
| Barbadians | 0.0 /100 | #335 | Tragic 3.9% |
| Immigrants | Bangladesh | 0.0 /100 | #336 | Tragic 3.9% |
| Vietnamese | 0.0 /100 | #337 | Tragic 3.9% |
| Immigrants | Cabo Verde | 0.0 /100 | #338 | Tragic 3.8% |
| Immigrants | Uzbekistan | 0.0 /100 | #339 | Tragic 3.6% |
| Immigrants | Barbados | 0.0 /100 | #340 | Tragic 3.6% |
Demographics Similar to Natives/Alaskans by 4 or more Vehicles in Household
In terms of 4 or more vehicles in household, the demographic groups most similar to Natives/Alaskans are Navajo (8.2%, a difference of 0.40%), Immigrants from South Eastern Asia (8.2%, a difference of 0.43%), Marshallese (8.1%, a difference of 0.53%), Yaqui (8.1%, a difference of 0.82%), and Cheyenne (8.3%, a difference of 1.1%).
| Demographics | Rating | Rank | 4 or more Vehicles in Household |
| Immigrants | Central America | 100.0 /100 | #24 | Exceptional 8.5% |
| Basques | 100.0 /100 | #25 | Exceptional 8.4% |
| Mexican American Indians | 100.0 /100 | #26 | Exceptional 8.4% |
| Sri Lankans | 100.0 /100 | #27 | Exceptional 8.4% |
| Cheyenne | 100.0 /100 | #28 | Exceptional 8.3% |
| Immigrants | South Eastern Asia | 100.0 /100 | #29 | Exceptional 8.2% |
| Navajo | 100.0 /100 | #30 | Exceptional 8.2% |
| Natives/Alaskans | 100.0 /100 | #31 | Exceptional 8.2% |
| Marshallese | 100.0 /100 | #32 | Exceptional 8.1% |
| Yaqui | 100.0 /100 | #33 | Exceptional 8.1% |
| Alaskan Athabascans | 100.0 /100 | #34 | Exceptional 8.1% |
| Guamanians/Chamorros | 100.0 /100 | #35 | Exceptional 8.1% |
| Norwegians | 100.0 /100 | #36 | Exceptional 8.0% |
| Scandinavians | 100.0 /100 | #37 | Exceptional 8.0% |
| Sioux | 100.0 /100 | #38 | Exceptional 8.0% |