Paiute vs Native/Alaskan In Labor Force | Age 16-19
COMPARE
Paiute
Native/Alaskan
In Labor Force | Age 16-19
In Labor Force | Age 16-19 Comparison
Paiute
Natives/Alaskans
37.5%
IN LABOR FORCE | AGE 16-19
89.3/ 100
METRIC RATING
145th/ 347
METRIC RANK
36.6%
IN LABOR FORCE | AGE 16-19
49.0/ 100
METRIC RATING
175th/ 347
METRIC RANK
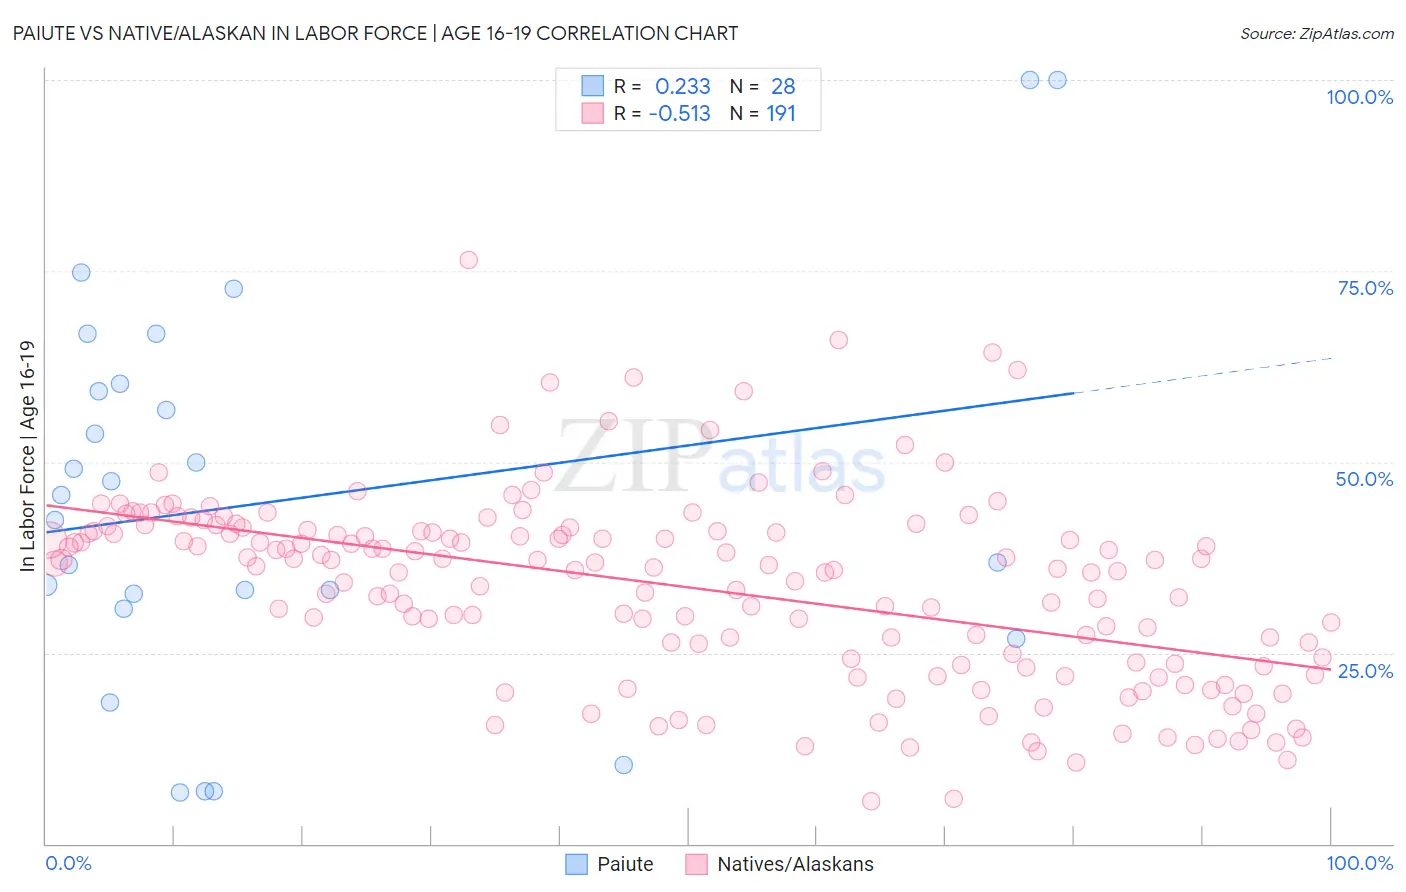
Paiute vs Native/Alaskan In Labor Force | Age 16-19 Correlation Chart
The statistical analysis conducted on geographies consisting of 58,354,197 people shows a weak positive correlation between the proportion of Paiute and labor force participation rate among population between the ages 16 and 19 in the United States with a correlation coefficient (R) of 0.233 and weighted average of 37.5%. Similarly, the statistical analysis conducted on geographies consisting of 511,038,872 people shows a substantial negative correlation between the proportion of Natives/Alaskans and labor force participation rate among population between the ages 16 and 19 in the United States with a correlation coefficient (R) of -0.513 and weighted average of 36.6%, a difference of 2.7%.
In Labor Force | Age 16-19 Correlation Summary
| Measurement | Paiute | Native/Alaskan |
| Minimum | 6.7% | 5.5% |
| Maximum | 100.0% | 76.4% |
| Range | 93.3% | 70.9% |
| Mean | 45.0% | 33.6% |
| Median | 44.1% | 36.4% |
| Interquartile 25% (IQ1) | 31.7% | 23.7% |
| Interquartile 75% (IQ3) | 59.8% | 41.0% |
| Interquartile Range (IQR) | 28.1% | 17.3% |
| Standard Deviation (Sample) | 25.0% | 12.4% |
| Standard Deviation (Population) | 24.5% | 12.3% |
Similar Demographics by In Labor Force | Age 16-19
Demographics Similar to Paiute by In Labor Force | Age 16-19
In terms of in labor force | age 16-19, the demographic groups most similar to Paiute are Japanese (37.5%, a difference of 0.0%), Pakistani (37.6%, a difference of 0.020%), Sierra Leonean (37.6%, a difference of 0.050%), Immigrants from Western Europe (37.5%, a difference of 0.050%), and Brazilian (37.5%, a difference of 0.080%).
| Demographics | Rating | Rank | In Labor Force | Age 16-19 |
| Comanche | 91.9 /100 | #138 | Exceptional 37.7% |
| Immigrants | Moldova | 91.9 /100 | #139 | Exceptional 37.7% |
| Estonians | 91.7 /100 | #140 | Exceptional 37.7% |
| Syrians | 90.7 /100 | #141 | Exceptional 37.6% |
| Sierra Leoneans | 89.7 /100 | #142 | Excellent 37.6% |
| Pakistanis | 89.5 /100 | #143 | Excellent 37.6% |
| Japanese | 89.3 /100 | #144 | Excellent 37.5% |
| Paiute | 89.3 /100 | #145 | Excellent 37.5% |
| Immigrants | Western Europe | 88.9 /100 | #146 | Excellent 37.5% |
| Brazilians | 88.7 /100 | #147 | Excellent 37.5% |
| Romanians | 87.3 /100 | #148 | Excellent 37.5% |
| Native Hawaiians | 85.0 /100 | #149 | Excellent 37.4% |
| Tsimshian | 84.7 /100 | #150 | Excellent 37.4% |
| Immigrants | Poland | 84.4 /100 | #151 | Excellent 37.3% |
| Immigrants | Sierra Leone | 83.6 /100 | #152 | Excellent 37.3% |
Demographics Similar to Natives/Alaskans by In Labor Force | Age 16-19
In terms of in labor force | age 16-19, the demographic groups most similar to Natives/Alaskans are Albanian (36.5%, a difference of 0.010%), Immigrants from Czechoslovakia (36.6%, a difference of 0.050%), Immigrants from Northern Europe (36.5%, a difference of 0.12%), Black/African American (36.5%, a difference of 0.20%), and Immigrants from Southern Europe (36.4%, a difference of 0.29%).
| Demographics | Rating | Rank | In Labor Force | Age 16-19 |
| Palestinians | 63.1 /100 | #168 | Good 36.8% |
| Immigrants | Latvia | 61.6 /100 | #169 | Good 36.8% |
| Immigrants | South Africa | 60.5 /100 | #170 | Good 36.8% |
| Immigrants | Cambodia | 58.4 /100 | #171 | Average 36.7% |
| South Africans | 58.3 /100 | #172 | Average 36.7% |
| Russians | 57.5 /100 | #173 | Average 36.7% |
| Immigrants | Czechoslovakia | 50.0 /100 | #174 | Average 36.6% |
| Natives/Alaskans | 49.0 /100 | #175 | Average 36.6% |
| Albanians | 48.8 /100 | #176 | Average 36.5% |
| Immigrants | Northern Europe | 46.6 /100 | #177 | Average 36.5% |
| Blacks/African Americans | 45.1 /100 | #178 | Average 36.5% |
| Immigrants | Southern Europe | 43.3 /100 | #179 | Average 36.4% |
| Immigrants | Morocco | 41.1 /100 | #180 | Average 36.4% |
| Jordanians | 39.6 /100 | #181 | Fair 36.4% |
| Immigrants | Italy | 39.1 /100 | #182 | Fair 36.4% |