Immigrants from Bahamas vs Native/Alaskan 4 or more Vehicles in Household
COMPARE
Immigrants from Bahamas
Native/Alaskan
4 or more Vehicles in Household
4 or more Vehicles in Household Comparison
Immigrants from Bahamas
Natives/Alaskans
5.3%
4 OR MORE VEHICLES IN HOUSEHOLD
0.1/ 100
METRIC RATING
291st/ 347
METRIC RANK
8.2%
4 OR MORE VEHICLES IN HOUSEHOLD
100.0/ 100
METRIC RATING
31st/ 347
METRIC RANK
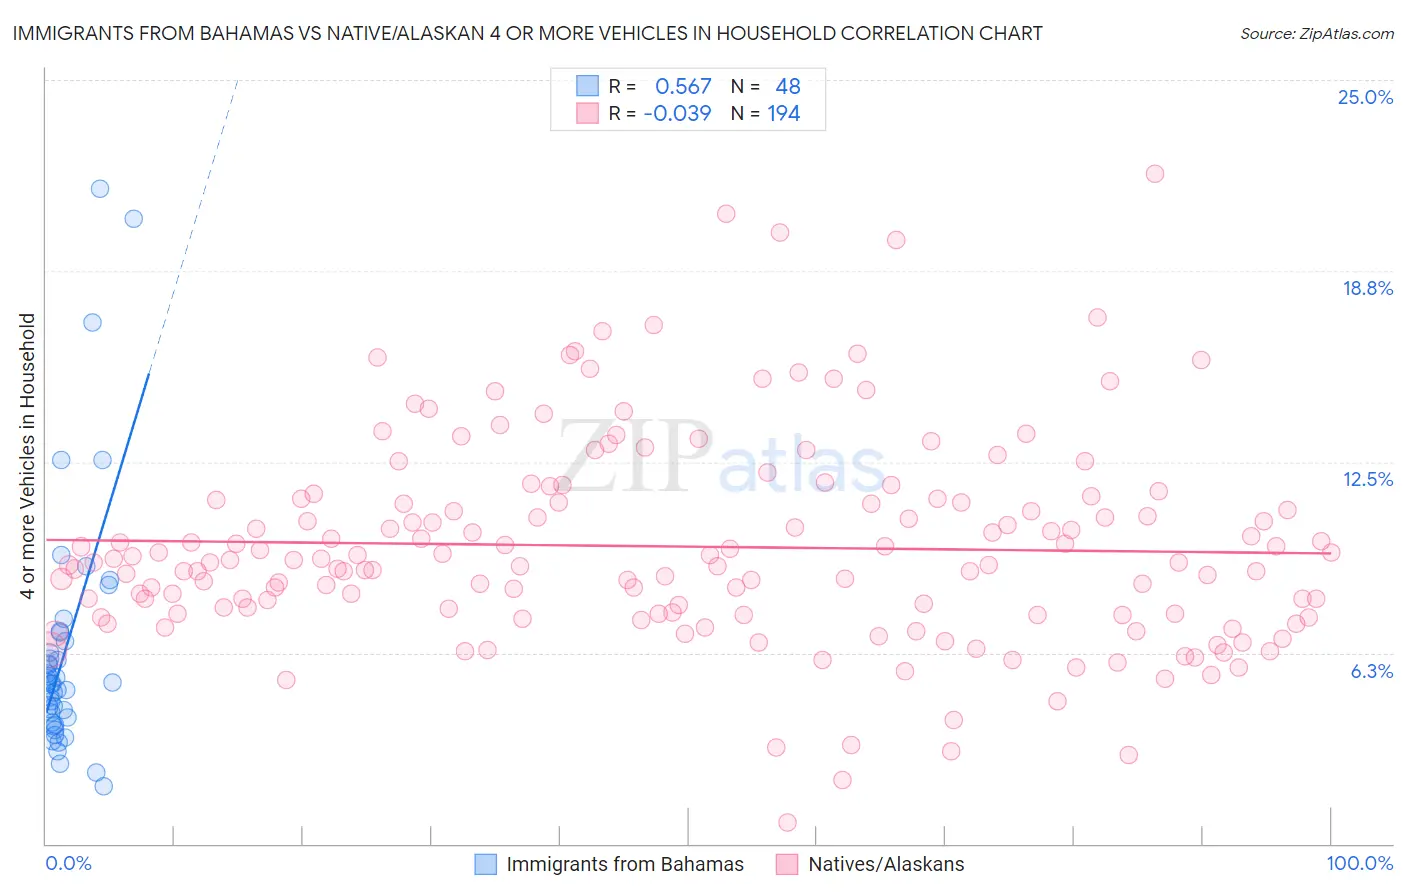
Immigrants from Bahamas vs Native/Alaskan 4 or more Vehicles in Household Correlation Chart
The statistical analysis conducted on geographies consisting of 104,355,564 people shows a substantial positive correlation between the proportion of Immigrants from Bahamas and percentage of households with 4 or more vehicles available in the United States with a correlation coefficient (R) of 0.567 and weighted average of 5.3%. Similarly, the statistical analysis conducted on geographies consisting of 510,504,827 people shows no correlation between the proportion of Natives/Alaskans and percentage of households with 4 or more vehicles available in the United States with a correlation coefficient (R) of -0.039 and weighted average of 8.2%, a difference of 55.8%.
4 or more Vehicles in Household Correlation Summary
| Measurement | Immigrants from Bahamas | Native/Alaskan |
| Minimum | 1.9% | 0.68% |
| Maximum | 21.5% | 21.9% |
| Range | 19.6% | 21.2% |
| Mean | 6.4% | 9.7% |
| Median | 5.3% | 9.2% |
| Interquartile 25% (IQ1) | 4.1% | 7.5% |
| Interquartile 75% (IQ3) | 6.8% | 11.3% |
| Interquartile Range (IQR) | 2.7% | 3.7% |
| Standard Deviation (Sample) | 4.1% | 3.4% |
| Standard Deviation (Population) | 4.1% | 3.4% |
Similar Demographics by 4 or more Vehicles in Household
Demographics Similar to Immigrants from Bahamas by 4 or more Vehicles in Household
In terms of 4 or more vehicles in household, the demographic groups most similar to Immigrants from Bahamas are Liberian (5.3%, a difference of 0.10%), Immigrants from Congo (5.2%, a difference of 0.13%), Ghanaian (5.2%, a difference of 0.19%), Immigrants from Brazil (5.2%, a difference of 0.30%), and Israeli (5.2%, a difference of 0.48%).
| Demographics | Rating | Rank | 4 or more Vehicles in Household |
| Brazilians | 0.3 /100 | #284 | Tragic 5.4% |
| Immigrants | Liberia | 0.2 /100 | #285 | Tragic 5.4% |
| Immigrants | Colombia | 0.2 /100 | #286 | Tragic 5.4% |
| Immigrants | Croatia | 0.2 /100 | #287 | Tragic 5.4% |
| Venezuelans | 0.2 /100 | #288 | Tragic 5.3% |
| Immigrants | Bosnia and Herzegovina | 0.2 /100 | #289 | Tragic 5.3% |
| Immigrants | Russia | 0.2 /100 | #290 | Tragic 5.3% |
| Immigrants | Bahamas | 0.1 /100 | #291 | Tragic 5.3% |
| Liberians | 0.1 /100 | #292 | Tragic 5.3% |
| Immigrants | Congo | 0.1 /100 | #293 | Tragic 5.2% |
| Ghanaians | 0.1 /100 | #294 | Tragic 5.2% |
| Immigrants | Brazil | 0.1 /100 | #295 | Tragic 5.2% |
| Israelis | 0.1 /100 | #296 | Tragic 5.2% |
| Immigrants | Venezuela | 0.1 /100 | #297 | Tragic 5.2% |
| Immigrants | South America | 0.1 /100 | #298 | Tragic 5.2% |
Demographics Similar to Natives/Alaskans by 4 or more Vehicles in Household
In terms of 4 or more vehicles in household, the demographic groups most similar to Natives/Alaskans are Navajo (8.2%, a difference of 0.40%), Immigrants from South Eastern Asia (8.2%, a difference of 0.43%), Marshallese (8.1%, a difference of 0.53%), Yaqui (8.1%, a difference of 0.82%), and Cheyenne (8.3%, a difference of 1.1%).
| Demographics | Rating | Rank | 4 or more Vehicles in Household |
| Immigrants | Central America | 100.0 /100 | #24 | Exceptional 8.5% |
| Basques | 100.0 /100 | #25 | Exceptional 8.4% |
| Mexican American Indians | 100.0 /100 | #26 | Exceptional 8.4% |
| Sri Lankans | 100.0 /100 | #27 | Exceptional 8.4% |
| Cheyenne | 100.0 /100 | #28 | Exceptional 8.3% |
| Immigrants | South Eastern Asia | 100.0 /100 | #29 | Exceptional 8.2% |
| Navajo | 100.0 /100 | #30 | Exceptional 8.2% |
| Natives/Alaskans | 100.0 /100 | #31 | Exceptional 8.2% |
| Marshallese | 100.0 /100 | #32 | Exceptional 8.1% |
| Yaqui | 100.0 /100 | #33 | Exceptional 8.1% |
| Alaskan Athabascans | 100.0 /100 | #34 | Exceptional 8.1% |
| Guamanians/Chamorros | 100.0 /100 | #35 | Exceptional 8.1% |
| Norwegians | 100.0 /100 | #36 | Exceptional 8.0% |
| Scandinavians | 100.0 /100 | #37 | Exceptional 8.0% |
| Sioux | 100.0 /100 | #38 | Exceptional 8.0% |