Paiute vs Barbadian GED/Equivalency
COMPARE
Paiute
Barbadian
GED/Equivalency
GED/Equivalency Comparison
Paiute
Barbadians
82.0%
GED/EQUIVALENCY
0.0/ 100
METRIC RATING
292nd/ 347
METRIC RANK
82.9%
GED/EQUIVALENCY
0.1/ 100
METRIC RATING
272nd/ 347
METRIC RANK
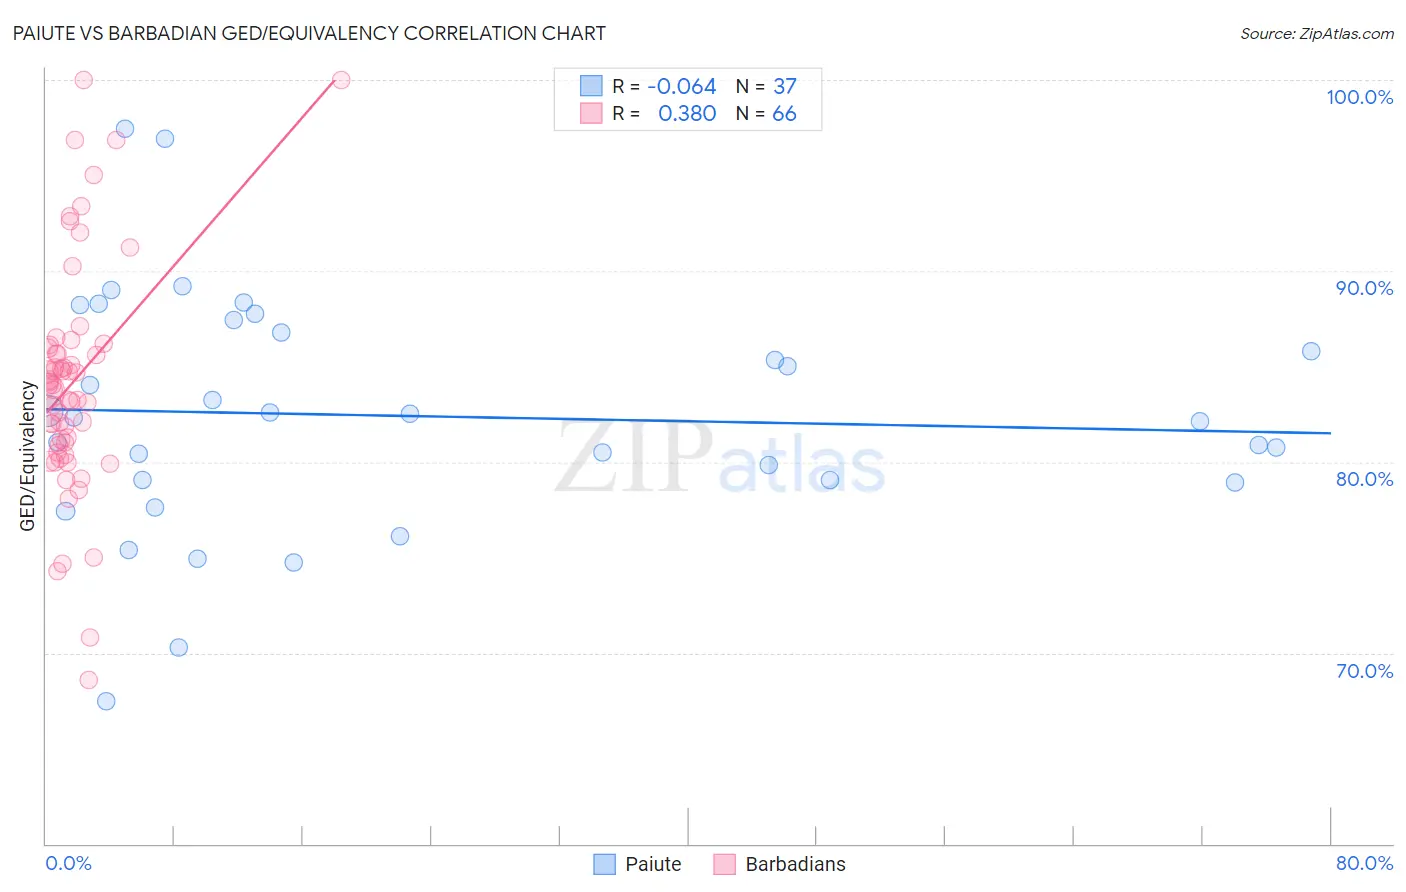
Paiute vs Barbadian GED/Equivalency Correlation Chart
The statistical analysis conducted on geographies consisting of 58,404,221 people shows a slight negative correlation between the proportion of Paiute and percentage of population with at least ged/equivalency education in the United States with a correlation coefficient (R) of -0.064 and weighted average of 82.0%. Similarly, the statistical analysis conducted on geographies consisting of 141,302,824 people shows a mild positive correlation between the proportion of Barbadians and percentage of population with at least ged/equivalency education in the United States with a correlation coefficient (R) of 0.380 and weighted average of 82.9%, a difference of 1.0%.
GED/Equivalency Correlation Summary
| Measurement | Paiute | Barbadian |
| Minimum | 67.5% | 68.6% |
| Maximum | 97.4% | 100.0% |
| Range | 29.9% | 31.4% |
| Mean | 82.4% | 84.2% |
| Median | 82.3% | 83.9% |
| Interquartile 25% (IQ1) | 79.0% | 80.9% |
| Interquartile 75% (IQ3) | 87.1% | 85.9% |
| Interquartile Range (IQR) | 8.1% | 5.0% |
| Standard Deviation (Sample) | 6.3% | 6.0% |
| Standard Deviation (Population) | 6.2% | 6.0% |
Demographics Similar to Paiute and Barbadians by GED/Equivalency
In terms of ged/equivalency, the demographic groups most similar to Paiute are Cuban (82.0%, a difference of 0.040%), Haitian (82.1%, a difference of 0.060%), Immigrants from Cambodia (82.2%, a difference of 0.25%), Pueblo (82.3%, a difference of 0.33%), and Japanese (82.4%, a difference of 0.43%). Similarly, the demographic groups most similar to Barbadians are Pennsylvania German (82.9%, a difference of 0.010%), Immigrants from Trinidad and Tobago (82.8%, a difference of 0.020%), Seminole (82.8%, a difference of 0.090%), Black/African American (82.8%, a difference of 0.11%), and Arapaho (82.8%, a difference of 0.12%).
| Demographics | Rating | Rank | GED/Equivalency |
| Barbadians | 0.1 /100 | #272 | Tragic 82.9% |
| Pennsylvania Germans | 0.1 /100 | #273 | Tragic 82.9% |
| Immigrants | Trinidad and Tobago | 0.1 /100 | #274 | Tragic 82.8% |
| Seminole | 0.1 /100 | #275 | Tragic 82.8% |
| Blacks/African Americans | 0.1 /100 | #276 | Tragic 82.8% |
| Arapaho | 0.1 /100 | #277 | Tragic 82.8% |
| Immigrants | Laos | 0.1 /100 | #278 | Tragic 82.7% |
| Immigrants | Fiji | 0.1 /100 | #279 | Tragic 82.7% |
| Cheyenne | 0.1 /100 | #280 | Tragic 82.7% |
| Sioux | 0.1 /100 | #281 | Tragic 82.6% |
| Immigrants | Immigrants | 0.1 /100 | #282 | Tragic 82.6% |
| Indonesians | 0.1 /100 | #283 | Tragic 82.5% |
| Immigrants | Barbados | 0.1 /100 | #284 | Tragic 82.4% |
| Cajuns | 0.0 /100 | #285 | Tragic 82.4% |
| Immigrants | West Indies | 0.0 /100 | #286 | Tragic 82.4% |
| Japanese | 0.0 /100 | #287 | Tragic 82.4% |
| Pueblo | 0.0 /100 | #288 | Tragic 82.3% |
| Immigrants | Cambodia | 0.0 /100 | #289 | Tragic 82.2% |
| Haitians | 0.0 /100 | #290 | Tragic 82.1% |
| Cubans | 0.0 /100 | #291 | Tragic 82.0% |
| Paiute | 0.0 /100 | #292 | Tragic 82.0% |