New Zealander vs Immigrants from St. Vincent and the Grenadines 1 or more Vehicles in Household
COMPARE
New Zealander
Immigrants from St. Vincent and the Grenadines
1 or more Vehicles in Household
1 or more Vehicles in Household Comparison
New Zealanders
Immigrants from St. Vincent and the Grenadines
90.1%
1 OR MORE VEHICLES IN HOUSEHOLD
73.8/ 100
METRIC RATING
153rd/ 347
METRIC RANK
64.7%
1 OR MORE VEHICLES IN HOUSEHOLD
0.0/ 100
METRIC RATING
345th/ 347
METRIC RANK
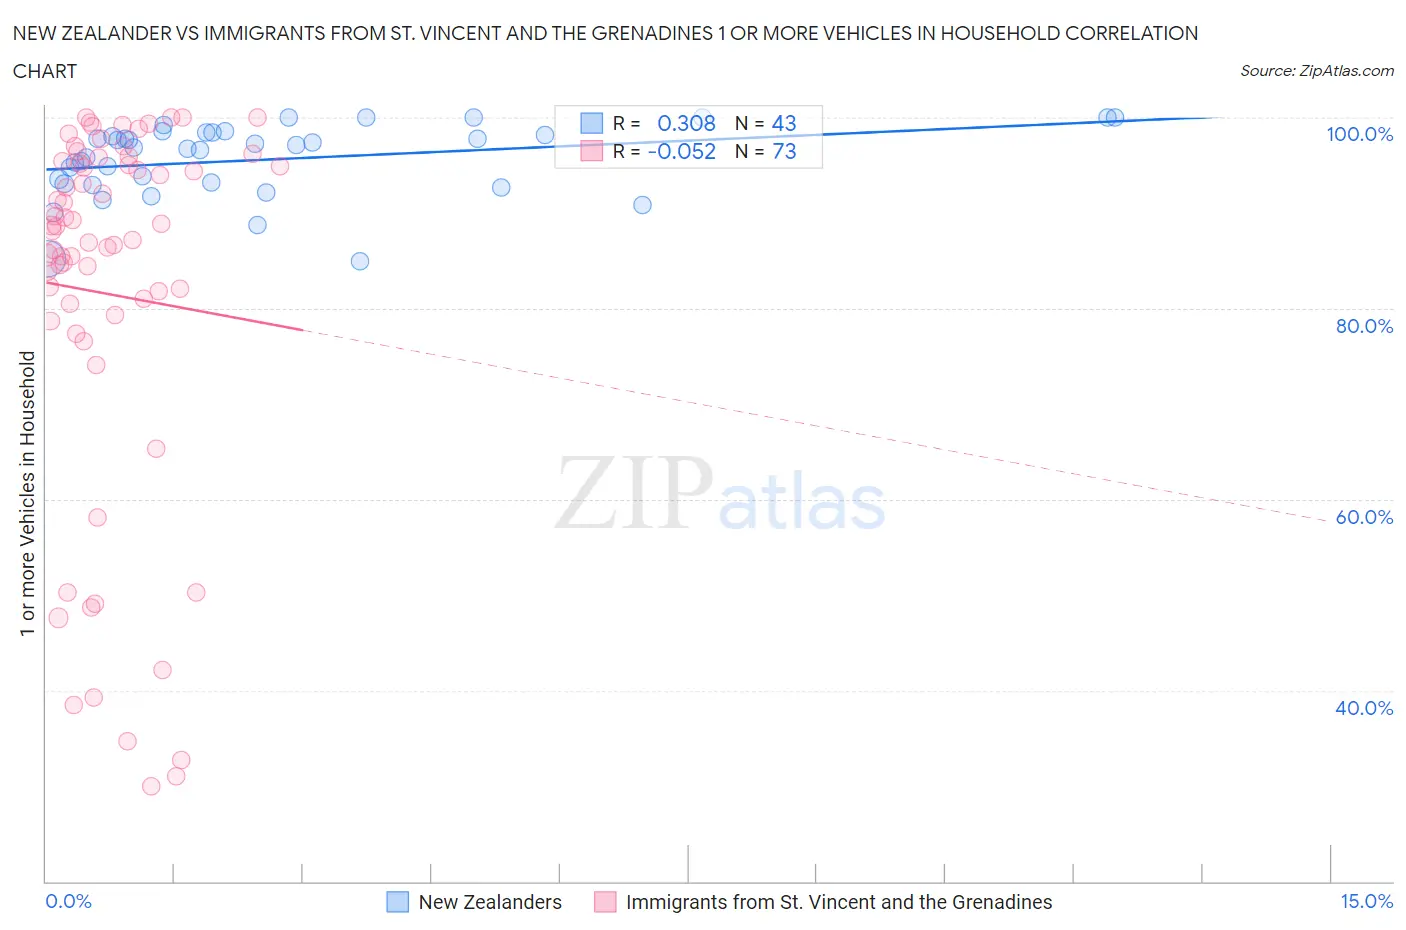
New Zealander vs Immigrants from St. Vincent and the Grenadines 1 or more Vehicles in Household Correlation Chart
The statistical analysis conducted on geographies consisting of 106,884,336 people shows a mild positive correlation between the proportion of New Zealanders and percentage of households with 1 or more vehicles available in the United States with a correlation coefficient (R) of 0.308 and weighted average of 90.1%. Similarly, the statistical analysis conducted on geographies consisting of 56,188,620 people shows a slight negative correlation between the proportion of Immigrants from St. Vincent and the Grenadines and percentage of households with 1 or more vehicles available in the United States with a correlation coefficient (R) of -0.052 and weighted average of 64.7%, a difference of 39.2%.
1 or more Vehicles in Household Correlation Summary
| Measurement | New Zealander | Immigrants from St. Vincent and the Grenadines |
| Minimum | 85.0% | 30.0% |
| Maximum | 100.0% | 100.0% |
| Range | 15.0% | 70.0% |
| Mean | 95.6% | 81.5% |
| Median | 96.8% | 88.2% |
| Interquartile 25% (IQ1) | 93.0% | 79.0% |
| Interquartile 75% (IQ3) | 98.4% | 95.2% |
| Interquartile Range (IQR) | 5.4% | 16.2% |
| Standard Deviation (Sample) | 3.8% | 19.9% |
| Standard Deviation (Population) | 3.8% | 19.8% |
Similar Demographics by 1 or more Vehicles in Household
Demographics Similar to New Zealanders by 1 or more Vehicles in Household
In terms of 1 or more vehicles in household, the demographic groups most similar to New Zealanders are Immigrants from Uganda (90.1%, a difference of 0.0%), Immigrants (90.1%, a difference of 0.0%), Tlingit-Haida (90.1%, a difference of 0.010%), Immigrants from Bosnia and Herzegovina (90.1%, a difference of 0.030%), and Australian (90.0%, a difference of 0.030%).
| Demographics | Rating | Rank | 1 or more Vehicles in Household |
| Bahamians | 80.5 /100 | #146 | Excellent 90.2% |
| Chileans | 79.8 /100 | #147 | Good 90.2% |
| Immigrants | Eastern Africa | 78.2 /100 | #148 | Good 90.1% |
| Immigrants | Nicaragua | 76.7 /100 | #149 | Good 90.1% |
| Immigrants | Micronesia | 75.9 /100 | #150 | Good 90.1% |
| Immigrants | Bosnia and Herzegovina | 75.4 /100 | #151 | Good 90.1% |
| Tlingit-Haida | 74.3 /100 | #152 | Good 90.1% |
| New Zealanders | 73.8 /100 | #153 | Good 90.1% |
| Immigrants | Uganda | 73.8 /100 | #154 | Good 90.1% |
| Immigrants | Immigrants | 73.6 /100 | #155 | Good 90.1% |
| Australians | 72.4 /100 | #156 | Good 90.0% |
| Immigrants | Congo | 71.2 /100 | #157 | Good 90.0% |
| Brazilians | 71.0 /100 | #158 | Good 90.0% |
| South Africans | 69.7 /100 | #159 | Good 90.0% |
| Immigrants | Indonesia | 68.8 /100 | #160 | Good 90.0% |
Demographics Similar to Immigrants from St. Vincent and the Grenadines by 1 or more Vehicles in Household
In terms of 1 or more vehicles in household, the demographic groups most similar to Immigrants from St. Vincent and the Grenadines are Immigrants from Grenada (62.7%, a difference of 3.2%), Immigrants from Dominican Republic (68.6%, a difference of 6.1%), British West Indian (70.4%, a difference of 8.8%), Immigrants from Guyana (70.6%, a difference of 9.1%), and Immigrants from Barbados (70.6%, a difference of 9.1%).
| Demographics | Rating | Rank | 1 or more Vehicles in Household |
| Immigrants | Ecuador | 0.0 /100 | #333 | Tragic 76.2% |
| Immigrants | Bangladesh | 0.0 /100 | #334 | Tragic 74.3% |
| Barbadians | 0.0 /100 | #335 | Tragic 74.0% |
| Vietnamese | 0.0 /100 | #336 | Tragic 73.8% |
| Immigrants | Uzbekistan | 0.0 /100 | #337 | Tragic 73.4% |
| Inupiat | 0.0 /100 | #338 | Tragic 71.5% |
| Guyanese | 0.0 /100 | #339 | Tragic 70.8% |
| Dominicans | 0.0 /100 | #340 | Tragic 70.7% |
| Immigrants | Barbados | 0.0 /100 | #341 | Tragic 70.6% |
| Immigrants | Guyana | 0.0 /100 | #342 | Tragic 70.6% |
| British West Indians | 0.0 /100 | #343 | Tragic 70.4% |
| Immigrants | Dominican Republic | 0.0 /100 | #344 | Tragic 68.6% |
| Immigrants | St. Vincent and the Grenadines | 0.0 /100 | #345 | Tragic 64.7% |
| Immigrants | Grenada | 0.0 /100 | #346 | Tragic 62.7% |
| Yup'ik | 0.0 /100 | #347 | Tragic 58.4% |