Israeli vs Immigrants from St. Vincent and the Grenadines 1 or more Vehicles in Household
COMPARE
Israeli
Immigrants from St. Vincent and the Grenadines
1 or more Vehicles in Household
1 or more Vehicles in Household Comparison
Israelis
Immigrants from St. Vincent and the Grenadines
87.7%
1 OR MORE VEHICLES IN HOUSEHOLD
0.3/ 100
METRIC RATING
266th/ 347
METRIC RANK
64.7%
1 OR MORE VEHICLES IN HOUSEHOLD
0.0/ 100
METRIC RATING
345th/ 347
METRIC RANK
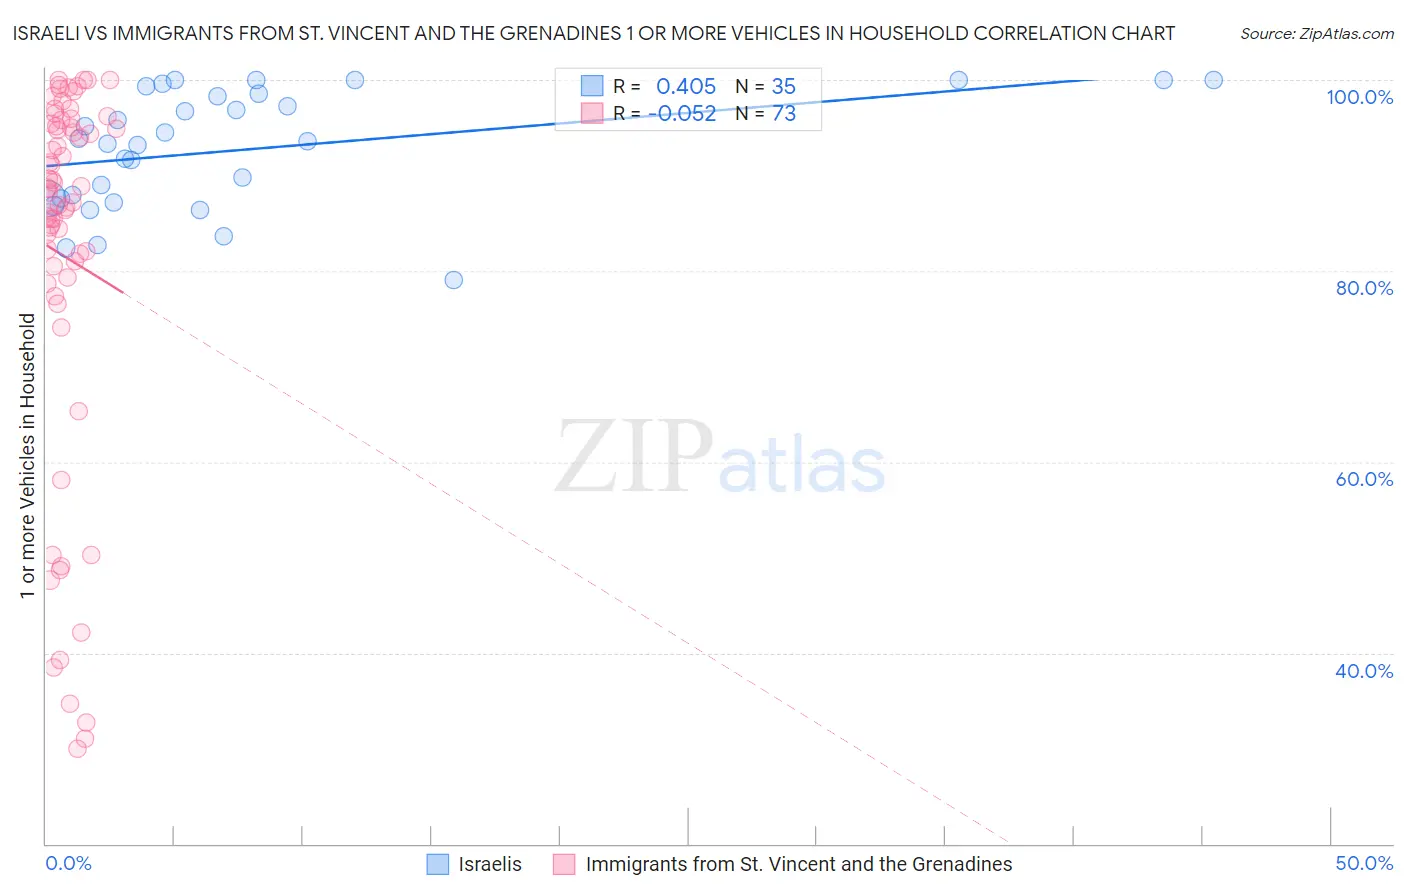
Israeli vs Immigrants from St. Vincent and the Grenadines 1 or more Vehicles in Household Correlation Chart
The statistical analysis conducted on geographies consisting of 211,015,607 people shows a moderate positive correlation between the proportion of Israelis and percentage of households with 1 or more vehicles available in the United States with a correlation coefficient (R) of 0.405 and weighted average of 87.7%. Similarly, the statistical analysis conducted on geographies consisting of 56,188,620 people shows a slight negative correlation between the proportion of Immigrants from St. Vincent and the Grenadines and percentage of households with 1 or more vehicles available in the United States with a correlation coefficient (R) of -0.052 and weighted average of 64.7%, a difference of 35.5%.
1 or more Vehicles in Household Correlation Summary
| Measurement | Israeli | Immigrants from St. Vincent and the Grenadines |
| Minimum | 79.1% | 30.0% |
| Maximum | 100.0% | 100.0% |
| Range | 20.9% | 70.0% |
| Mean | 92.7% | 81.5% |
| Median | 93.5% | 88.2% |
| Interquartile 25% (IQ1) | 87.6% | 79.0% |
| Interquartile 75% (IQ3) | 98.5% | 95.2% |
| Interquartile Range (IQR) | 11.0% | 16.2% |
| Standard Deviation (Sample) | 6.1% | 19.9% |
| Standard Deviation (Population) | 6.0% | 19.8% |
Similar Demographics by 1 or more Vehicles in Household
Demographics Similar to Israelis by 1 or more Vehicles in Household
In terms of 1 or more vehicles in household, the demographic groups most similar to Israelis are Immigrants from Colombia (87.6%, a difference of 0.030%), Immigrants from Europe (87.6%, a difference of 0.070%), Immigrants from Africa (87.6%, a difference of 0.12%), Panamanian (87.5%, a difference of 0.13%), and Bermudan (87.5%, a difference of 0.13%).
| Demographics | Rating | Rank | 1 or more Vehicles in Household |
| Nigerians | 0.8 /100 | #259 | Tragic 88.0% |
| Macedonians | 0.6 /100 | #260 | Tragic 87.9% |
| Immigrants | Switzerland | 0.6 /100 | #261 | Tragic 87.9% |
| Sub-Saharan Africans | 0.5 /100 | #262 | Tragic 87.9% |
| Immigrants | Egypt | 0.5 /100 | #263 | Tragic 87.8% |
| Immigrants | Liberia | 0.4 /100 | #264 | Tragic 87.8% |
| Africans | 0.4 /100 | #265 | Tragic 87.8% |
| Israelis | 0.3 /100 | #266 | Tragic 87.7% |
| Immigrants | Colombia | 0.3 /100 | #267 | Tragic 87.6% |
| Immigrants | Europe | 0.2 /100 | #268 | Tragic 87.6% |
| Immigrants | Africa | 0.2 /100 | #269 | Tragic 87.6% |
| Panamanians | 0.2 /100 | #270 | Tragic 87.5% |
| Bermudans | 0.2 /100 | #271 | Tragic 87.5% |
| Aleuts | 0.2 /100 | #272 | Tragic 87.5% |
| Immigrants | Northern Africa | 0.2 /100 | #273 | Tragic 87.4% |
Demographics Similar to Immigrants from St. Vincent and the Grenadines by 1 or more Vehicles in Household
In terms of 1 or more vehicles in household, the demographic groups most similar to Immigrants from St. Vincent and the Grenadines are Immigrants from Grenada (62.7%, a difference of 3.2%), Immigrants from Dominican Republic (68.6%, a difference of 6.1%), British West Indian (70.4%, a difference of 8.8%), Immigrants from Guyana (70.6%, a difference of 9.1%), and Immigrants from Barbados (70.6%, a difference of 9.1%).
| Demographics | Rating | Rank | 1 or more Vehicles in Household |
| Immigrants | Ecuador | 0.0 /100 | #333 | Tragic 76.2% |
| Immigrants | Bangladesh | 0.0 /100 | #334 | Tragic 74.3% |
| Barbadians | 0.0 /100 | #335 | Tragic 74.0% |
| Vietnamese | 0.0 /100 | #336 | Tragic 73.8% |
| Immigrants | Uzbekistan | 0.0 /100 | #337 | Tragic 73.4% |
| Inupiat | 0.0 /100 | #338 | Tragic 71.5% |
| Guyanese | 0.0 /100 | #339 | Tragic 70.8% |
| Dominicans | 0.0 /100 | #340 | Tragic 70.7% |
| Immigrants | Barbados | 0.0 /100 | #341 | Tragic 70.6% |
| Immigrants | Guyana | 0.0 /100 | #342 | Tragic 70.6% |
| British West Indians | 0.0 /100 | #343 | Tragic 70.4% |
| Immigrants | Dominican Republic | 0.0 /100 | #344 | Tragic 68.6% |
| Immigrants | St. Vincent and the Grenadines | 0.0 /100 | #345 | Tragic 64.7% |
| Immigrants | Grenada | 0.0 /100 | #346 | Tragic 62.7% |
| Yup'ik | 0.0 /100 | #347 | Tragic 58.4% |