Immigrants from South America vs Immigrants from St. Vincent and the Grenadines 1 or more Vehicles in Household
COMPARE
Immigrants from South America
Immigrants from St. Vincent and the Grenadines
1 or more Vehicles in Household
1 or more Vehicles in Household Comparison
Immigrants from South America
Immigrants from St. Vincent and the Grenadines
88.8%
1 OR MORE VEHICLES IN HOUSEHOLD
7.0/ 100
METRIC RATING
223rd/ 347
METRIC RANK
64.7%
1 OR MORE VEHICLES IN HOUSEHOLD
0.0/ 100
METRIC RATING
345th/ 347
METRIC RANK
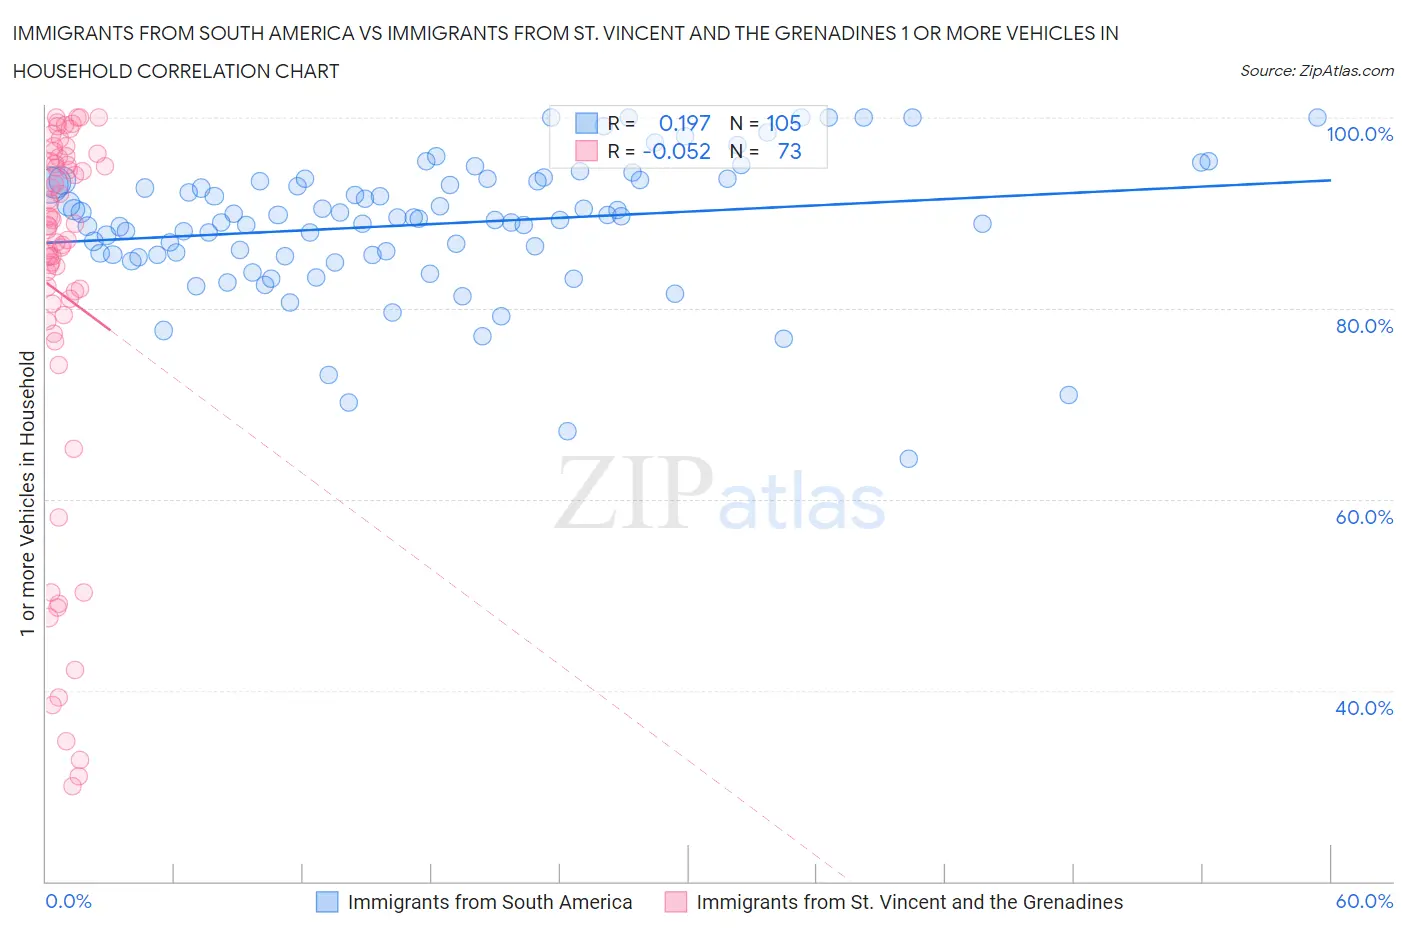
Immigrants from South America vs Immigrants from St. Vincent and the Grenadines 1 or more Vehicles in Household Correlation Chart
The statistical analysis conducted on geographies consisting of 476,014,364 people shows a poor positive correlation between the proportion of Immigrants from South America and percentage of households with 1 or more vehicles available in the United States with a correlation coefficient (R) of 0.197 and weighted average of 88.8%. Similarly, the statistical analysis conducted on geographies consisting of 56,188,620 people shows a slight negative correlation between the proportion of Immigrants from St. Vincent and the Grenadines and percentage of households with 1 or more vehicles available in the United States with a correlation coefficient (R) of -0.052 and weighted average of 64.7%, a difference of 37.3%.
1 or more Vehicles in Household Correlation Summary
| Measurement | Immigrants from South America | Immigrants from St. Vincent and the Grenadines |
| Minimum | 64.3% | 30.0% |
| Maximum | 100.0% | 100.0% |
| Range | 35.7% | 70.0% |
| Mean | 88.8% | 81.5% |
| Median | 89.5% | 88.2% |
| Interquartile 25% (IQ1) | 85.6% | 79.0% |
| Interquartile 75% (IQ3) | 93.4% | 95.2% |
| Interquartile Range (IQR) | 7.8% | 16.2% |
| Standard Deviation (Sample) | 7.0% | 19.9% |
| Standard Deviation (Population) | 7.0% | 19.8% |
Similar Demographics by 1 or more Vehicles in Household
Demographics Similar to Immigrants from South America by 1 or more Vehicles in Household
In terms of 1 or more vehicles in household, the demographic groups most similar to Immigrants from South America are Uruguayan (88.8%, a difference of 0.0%), Peruvian (88.8%, a difference of 0.050%), Immigrants from Hong Kong (88.7%, a difference of 0.050%), Cree (88.7%, a difference of 0.060%), and Immigrants from Zaire (88.8%, a difference of 0.070%).
| Demographics | Rating | Rank | 1 or more Vehicles in Household |
| Immigrants | Argentina | 9.4 /100 | #216 | Tragic 88.9% |
| Argentineans | 8.8 /100 | #217 | Tragic 88.9% |
| Ugandans | 8.7 /100 | #218 | Tragic 88.9% |
| Immigrants | Guatemala | 8.6 /100 | #219 | Tragic 88.9% |
| Immigrants | Zaire | 8.1 /100 | #220 | Tragic 88.8% |
| Peruvians | 7.9 /100 | #221 | Tragic 88.8% |
| Uruguayans | 7.0 /100 | #222 | Tragic 88.8% |
| Immigrants | South America | 7.0 /100 | #223 | Tragic 88.8% |
| Immigrants | Hong Kong | 6.2 /100 | #224 | Tragic 88.7% |
| Cree | 6.0 /100 | #225 | Tragic 88.7% |
| Cheyenne | 5.7 /100 | #226 | Tragic 88.7% |
| Ute | 5.6 /100 | #227 | Tragic 88.7% |
| Immigrants | Norway | 5.5 /100 | #228 | Tragic 88.7% |
| Immigrants | Romania | 5.4 /100 | #229 | Tragic 88.7% |
| Immigrants | Sierra Leone | 5.2 /100 | #230 | Tragic 88.7% |
Demographics Similar to Immigrants from St. Vincent and the Grenadines by 1 or more Vehicles in Household
In terms of 1 or more vehicles in household, the demographic groups most similar to Immigrants from St. Vincent and the Grenadines are Immigrants from Grenada (62.7%, a difference of 3.2%), Immigrants from Dominican Republic (68.6%, a difference of 6.1%), British West Indian (70.4%, a difference of 8.8%), Immigrants from Guyana (70.6%, a difference of 9.1%), and Immigrants from Barbados (70.6%, a difference of 9.1%).
| Demographics | Rating | Rank | 1 or more Vehicles in Household |
| Immigrants | Ecuador | 0.0 /100 | #333 | Tragic 76.2% |
| Immigrants | Bangladesh | 0.0 /100 | #334 | Tragic 74.3% |
| Barbadians | 0.0 /100 | #335 | Tragic 74.0% |
| Vietnamese | 0.0 /100 | #336 | Tragic 73.8% |
| Immigrants | Uzbekistan | 0.0 /100 | #337 | Tragic 73.4% |
| Inupiat | 0.0 /100 | #338 | Tragic 71.5% |
| Guyanese | 0.0 /100 | #339 | Tragic 70.8% |
| Dominicans | 0.0 /100 | #340 | Tragic 70.7% |
| Immigrants | Barbados | 0.0 /100 | #341 | Tragic 70.6% |
| Immigrants | Guyana | 0.0 /100 | #342 | Tragic 70.6% |
| British West Indians | 0.0 /100 | #343 | Tragic 70.4% |
| Immigrants | Dominican Republic | 0.0 /100 | #344 | Tragic 68.6% |
| Immigrants | St. Vincent and the Grenadines | 0.0 /100 | #345 | Tragic 64.7% |
| Immigrants | Grenada | 0.0 /100 | #346 | Tragic 62.7% |
| Yup'ik | 0.0 /100 | #347 | Tragic 58.4% |