New Zealander vs Immigrants from St. Vincent and the Grenadines Poverty
COMPARE
New Zealander
Immigrants from St. Vincent and the Grenadines
Poverty
Poverty Comparison
New Zealanders
Immigrants from St. Vincent and the Grenadines
11.7%
POVERTY
88.7/ 100
METRIC RATING
121st/ 347
METRIC RANK
14.9%
POVERTY
0.0/ 100
METRIC RATING
279th/ 347
METRIC RANK
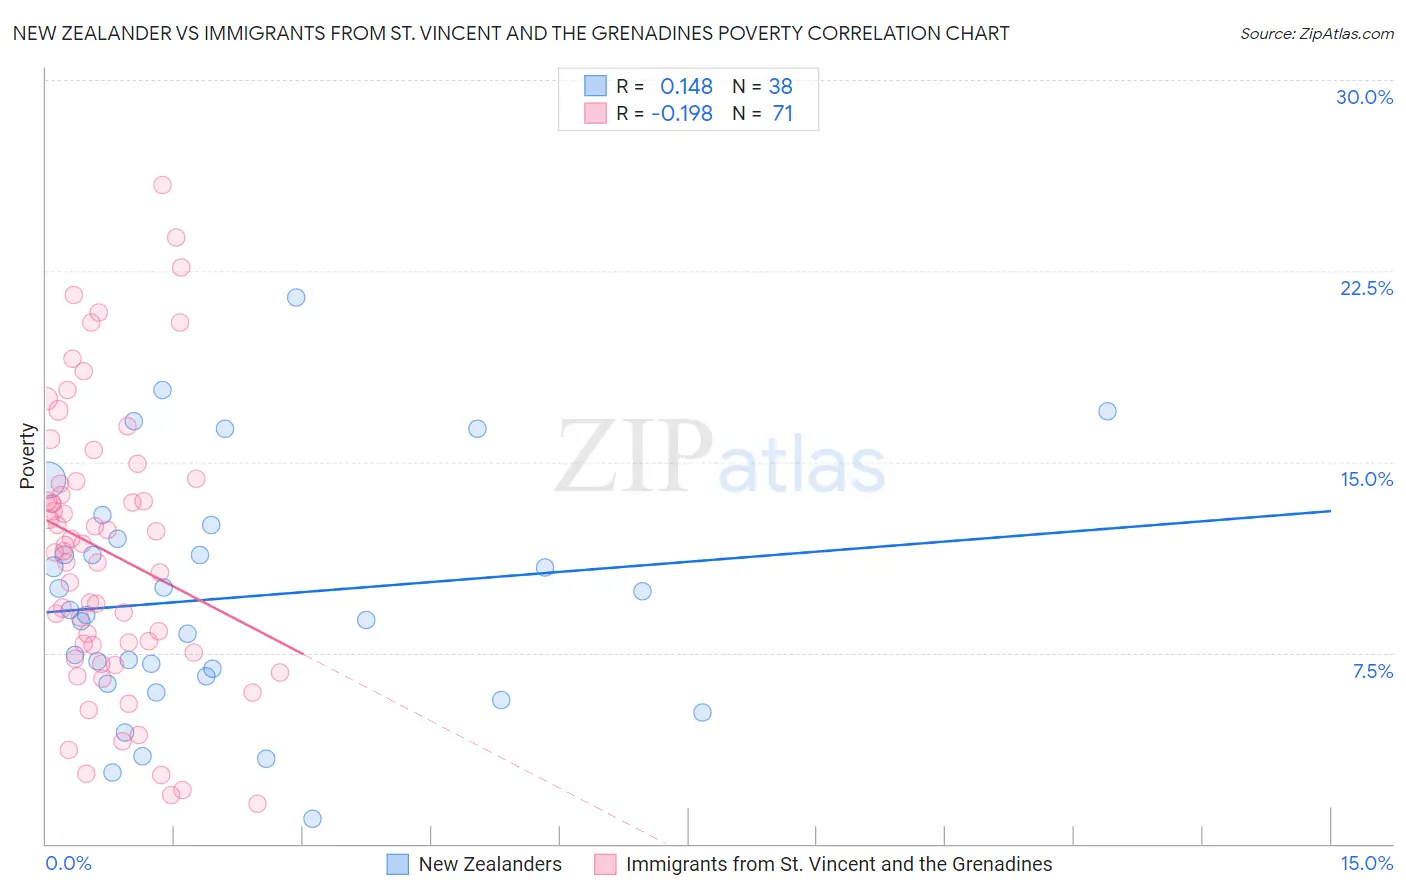
New Zealander vs Immigrants from St. Vincent and the Grenadines Poverty Correlation Chart
The statistical analysis conducted on geographies consisting of 106,895,719 people shows a poor positive correlation between the proportion of New Zealanders and poverty level in the United States with a correlation coefficient (R) of 0.148 and weighted average of 11.7%. Similarly, the statistical analysis conducted on geographies consisting of 56,091,353 people shows a poor negative correlation between the proportion of Immigrants from St. Vincent and the Grenadines and poverty level in the United States with a correlation coefficient (R) of -0.198 and weighted average of 14.9%, a difference of 27.0%.
Poverty Correlation Summary
| Measurement | New Zealander | Immigrants from St. Vincent and the Grenadines |
| Minimum | 0.99% | 1.6% |
| Maximum | 21.4% | 25.9% |
| Range | 20.4% | 24.3% |
| Mean | 9.7% | 11.5% |
| Median | 9.1% | 11.5% |
| Interquartile 25% (IQ1) | 6.6% | 7.5% |
| Interquartile 75% (IQ3) | 12.0% | 14.2% |
| Interquartile Range (IQR) | 5.4% | 6.7% |
| Standard Deviation (Sample) | 4.6% | 5.5% |
| Standard Deviation (Population) | 4.6% | 5.5% |
Similar Demographics by Poverty
Demographics Similar to New Zealanders by Poverty
In terms of poverty, the demographic groups most similar to New Zealanders are Puget Sound Salish (11.7%, a difference of 0.0%), Immigrants from Hungary (11.7%, a difference of 0.020%), Immigrants from South Eastern Asia (11.7%, a difference of 0.060%), Tlingit-Haida (11.7%, a difference of 0.070%), and Soviet Union (11.7%, a difference of 0.090%).
| Demographics | Rating | Rank | Poverty |
| Immigrants | China | 90.7 /100 | #114 | Exceptional 11.6% |
| Albanians | 90.3 /100 | #115 | Exceptional 11.7% |
| Immigrants | Russia | 89.7 /100 | #116 | Excellent 11.7% |
| Sri Lankans | 89.4 /100 | #117 | Excellent 11.7% |
| Argentineans | 89.1 /100 | #118 | Excellent 11.7% |
| Tlingit-Haida | 89.0 /100 | #119 | Excellent 11.7% |
| Immigrants | South Eastern Asia | 88.9 /100 | #120 | Excellent 11.7% |
| New Zealanders | 88.7 /100 | #121 | Excellent 11.7% |
| Puget Sound Salish | 88.7 /100 | #122 | Excellent 11.7% |
| Immigrants | Hungary | 88.6 /100 | #123 | Excellent 11.7% |
| Soviet Union | 88.4 /100 | #124 | Excellent 11.7% |
| Immigrants | Brazil | 88.2 /100 | #125 | Excellent 11.7% |
| Immigrants | Norway | 88.0 /100 | #126 | Excellent 11.7% |
| Immigrants | Argentina | 88.0 /100 | #127 | Excellent 11.7% |
| Immigrants | Israel | 87.4 /100 | #128 | Excellent 11.7% |
Demographics Similar to Immigrants from St. Vincent and the Grenadines by Poverty
In terms of poverty, the demographic groups most similar to Immigrants from St. Vincent and the Grenadines are Haitian (14.9%, a difference of 0.20%), Immigrants from Barbados (14.9%, a difference of 0.27%), Belizean (14.8%, a difference of 0.29%), Bangladeshi (14.8%, a difference of 0.31%), and Immigrants from West Indies (14.8%, a difference of 0.37%).
| Demographics | Rating | Rank | Poverty |
| Chickasaw | 0.0 /100 | #272 | Tragic 14.7% |
| Spanish Americans | 0.0 /100 | #273 | Tragic 14.7% |
| Barbadians | 0.0 /100 | #274 | Tragic 14.8% |
| Immigrants | West Indies | 0.0 /100 | #275 | Tragic 14.8% |
| Immigrants | Bahamas | 0.0 /100 | #276 | Tragic 14.8% |
| Bangladeshis | 0.0 /100 | #277 | Tragic 14.8% |
| Belizeans | 0.0 /100 | #278 | Tragic 14.8% |
| Immigrants | St. Vincent and the Grenadines | 0.0 /100 | #279 | Tragic 14.9% |
| Haitians | 0.0 /100 | #280 | Tragic 14.9% |
| Immigrants | Barbados | 0.0 /100 | #281 | Tragic 14.9% |
| Comanche | 0.0 /100 | #282 | Tragic 15.0% |
| Immigrants | Haiti | 0.0 /100 | #283 | Tragic 15.0% |
| West Indians | 0.0 /100 | #284 | Tragic 15.0% |
| Vietnamese | 0.0 /100 | #285 | Tragic 15.0% |
| Immigrants | Latin America | 0.0 /100 | #286 | Tragic 15.0% |