New Zealander vs Immigrants from St. Vincent and the Grenadines Married-couple Households
COMPARE
New Zealander
Immigrants from St. Vincent and the Grenadines
Married-couple Households
Married-couple Households Comparison
New Zealanders
Immigrants from St. Vincent and the Grenadines
47.2%
MARRIED-COUPLE HOUSEHOLDS
85.3/ 100
METRIC RATING
136th/ 347
METRIC RANK
38.7%
MARRIED-COUPLE HOUSEHOLDS
0.0/ 100
METRIC RATING
334th/ 347
METRIC RANK
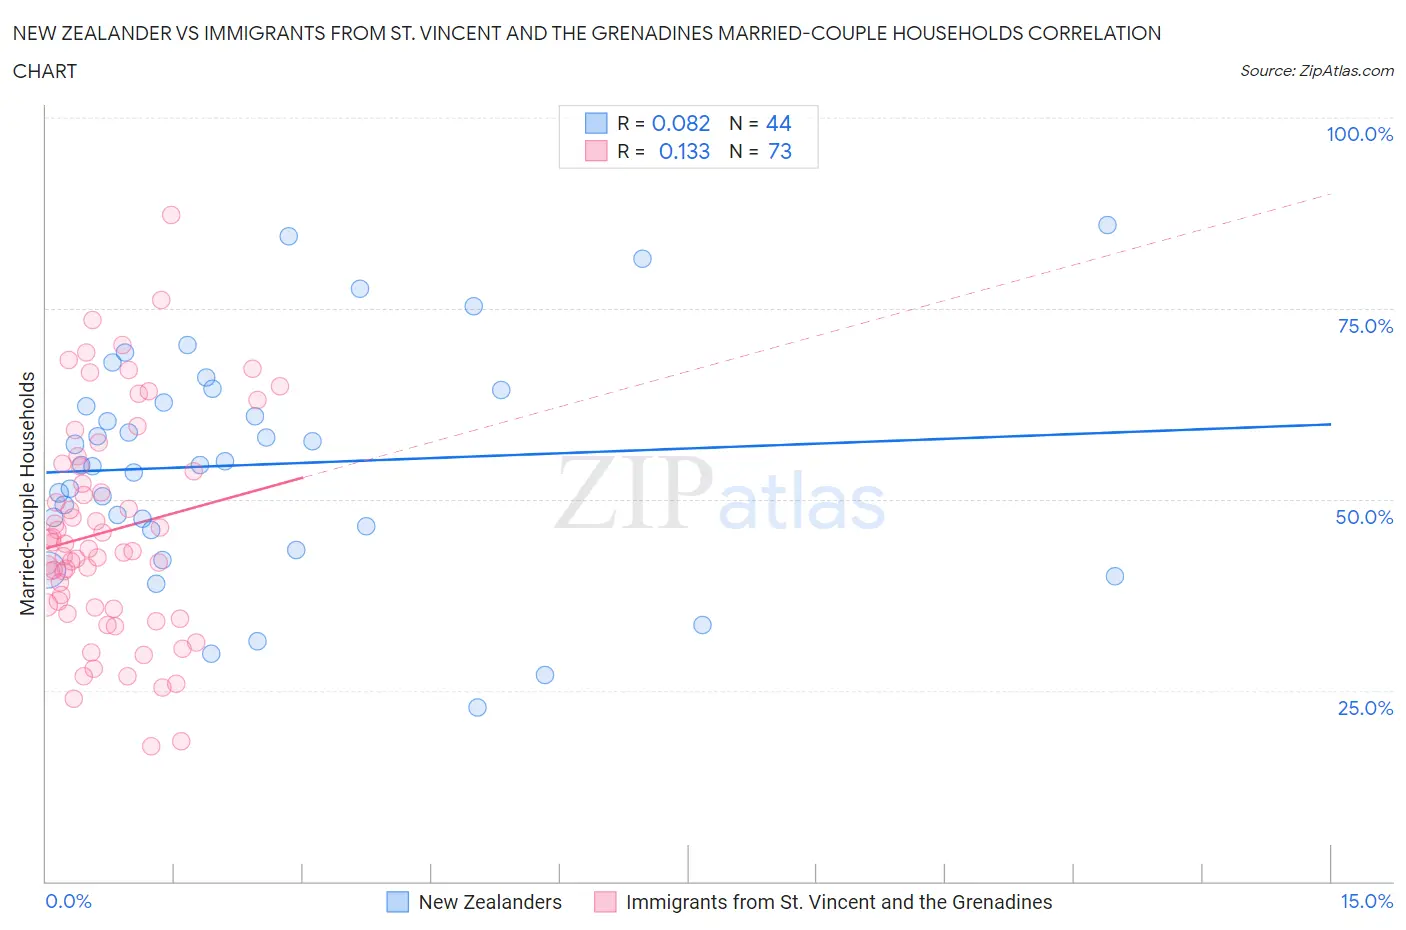
New Zealander vs Immigrants from St. Vincent and the Grenadines Married-couple Households Correlation Chart
The statistical analysis conducted on geographies consisting of 106,894,441 people shows a slight positive correlation between the proportion of New Zealanders and percentage of married-couple family households in the United States with a correlation coefficient (R) of 0.082 and weighted average of 47.2%. Similarly, the statistical analysis conducted on geographies consisting of 56,188,620 people shows a poor positive correlation between the proportion of Immigrants from St. Vincent and the Grenadines and percentage of married-couple family households in the United States with a correlation coefficient (R) of 0.133 and weighted average of 38.7%, a difference of 22.0%.
Married-couple Households Correlation Summary
| Measurement | New Zealander | Immigrants from St. Vincent and the Grenadines |
| Minimum | 22.7% | 17.7% |
| Maximum | 86.0% | 87.2% |
| Range | 63.3% | 69.5% |
| Mean | 54.6% | 45.8% |
| Median | 54.4% | 43.5% |
| Interquartile 25% (IQ1) | 46.3% | 35.8% |
| Interquartile 75% (IQ3) | 63.4% | 54.5% |
| Interquartile Range (IQR) | 17.2% | 18.8% |
| Standard Deviation (Sample) | 14.8% | 14.4% |
| Standard Deviation (Population) | 14.6% | 14.3% |
Similar Demographics by Married-couple Households
Demographics Similar to New Zealanders by Married-couple Households
In terms of married-couple households, the demographic groups most similar to New Zealanders are Immigrants from Malaysia (47.2%, a difference of 0.0%), Immigrants from Afghanistan (47.2%, a difference of 0.010%), Immigrants from Sweden (47.2%, a difference of 0.040%), Immigrants from Greece (47.2%, a difference of 0.050%), and Immigrants from Argentina (47.2%, a difference of 0.050%).
| Demographics | Rating | Rank | Married-couple Households |
| Immigrants | Iraq | 87.8 /100 | #129 | Excellent 47.3% |
| Immigrants | Hungary | 87.8 /100 | #130 | Excellent 47.3% |
| Immigrants | Denmark | 87.5 /100 | #131 | Excellent 47.3% |
| Immigrants | Ukraine | 86.7 /100 | #132 | Excellent 47.3% |
| South Africans | 86.4 /100 | #133 | Excellent 47.3% |
| Immigrants | Greece | 86.0 /100 | #134 | Excellent 47.2% |
| Immigrants | Argentina | 86.0 /100 | #135 | Excellent 47.2% |
| New Zealanders | 85.3 /100 | #136 | Excellent 47.2% |
| Immigrants | Malaysia | 85.2 /100 | #137 | Excellent 47.2% |
| Immigrants | Afghanistan | 85.1 /100 | #138 | Excellent 47.2% |
| Immigrants | Sweden | 84.7 /100 | #139 | Excellent 47.2% |
| Spanish | 84.5 /100 | #140 | Excellent 47.2% |
| Costa Ricans | 84.4 /100 | #141 | Excellent 47.2% |
| Spaniards | 84.1 /100 | #142 | Excellent 47.2% |
| Immigrants | Belarus | 83.8 /100 | #143 | Excellent 47.2% |
Demographics Similar to Immigrants from St. Vincent and the Grenadines by Married-couple Households
In terms of married-couple households, the demographic groups most similar to Immigrants from St. Vincent and the Grenadines are Senegalese (38.6%, a difference of 0.33%), Black/African American (38.5%, a difference of 0.51%), Immigrants from Somalia (38.4%, a difference of 0.66%), Immigrants from West Indies (39.0%, a difference of 0.78%), and Somali (39.0%, a difference of 0.81%).
| Demographics | Rating | Rank | Married-couple Households |
| Lumbee | 0.0 /100 | #327 | Tragic 39.6% |
| Barbadians | 0.0 /100 | #328 | Tragic 39.4% |
| Immigrants | Dominica | 0.0 /100 | #329 | Tragic 39.4% |
| Immigrants | Barbados | 0.0 /100 | #330 | Tragic 39.2% |
| Immigrants | Congo | 0.0 /100 | #331 | Tragic 39.0% |
| Somalis | 0.0 /100 | #332 | Tragic 39.0% |
| Immigrants | West Indies | 0.0 /100 | #333 | Tragic 39.0% |
| Immigrants | St. Vincent and the Grenadines | 0.0 /100 | #334 | Tragic 38.7% |
| Senegalese | 0.0 /100 | #335 | Tragic 38.6% |
| Blacks/African Americans | 0.0 /100 | #336 | Tragic 38.5% |
| Immigrants | Somalia | 0.0 /100 | #337 | Tragic 38.4% |
| Immigrants | Senegal | 0.0 /100 | #338 | Tragic 38.4% |
| British West Indians | 0.0 /100 | #339 | Tragic 38.3% |
| Dominicans | 0.0 /100 | #340 | Tragic 38.2% |
| Cape Verdeans | 0.0 /100 | #341 | Tragic 38.1% |