Nepalese vs Barbadian 2 or more Vehicles in Household
COMPARE
Nepalese
Barbadian
2 or more Vehicles in Household
2 or more Vehicles in Household Comparison
Nepalese
Barbadians
61.4%
2 OR MORE VEHICLES IN HOUSEHOLD
100.0/ 100
METRIC RATING
15th/ 347
METRIC RANK
38.3%
2 OR MORE VEHICLES IN HOUSEHOLD
0.0/ 100
METRIC RATING
337th/ 347
METRIC RANK
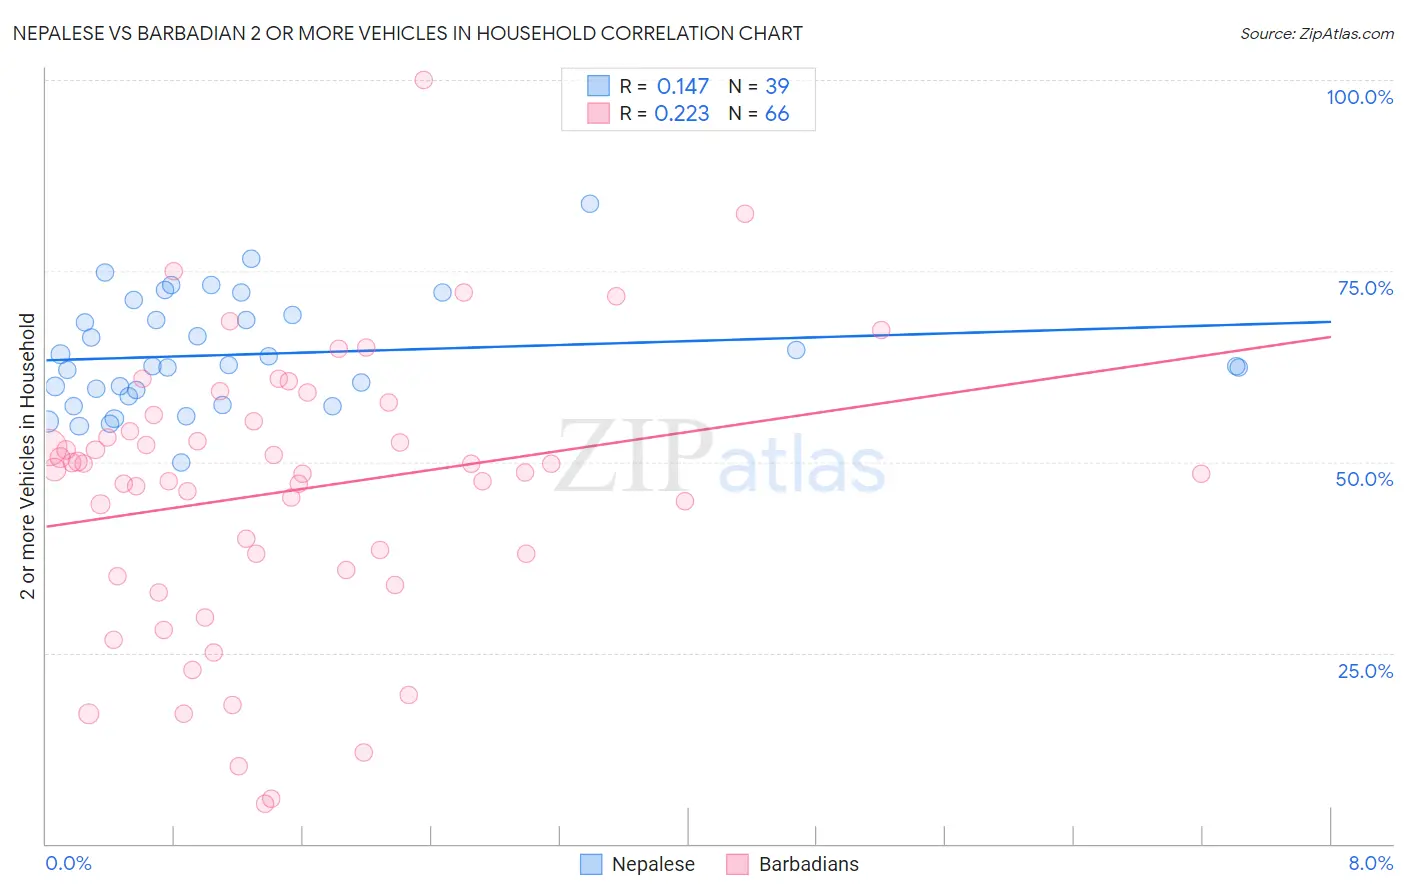
Nepalese vs Barbadian 2 or more Vehicles in Household Correlation Chart
The statistical analysis conducted on geographies consisting of 24,483,296 people shows a poor positive correlation between the proportion of Nepalese and percentage of households with 2 or more vehicles available in the United States with a correlation coefficient (R) of 0.147 and weighted average of 61.4%. Similarly, the statistical analysis conducted on geographies consisting of 141,285,511 people shows a weak positive correlation between the proportion of Barbadians and percentage of households with 2 or more vehicles available in the United States with a correlation coefficient (R) of 0.223 and weighted average of 38.3%, a difference of 60.2%.
2 or more Vehicles in Household Correlation Summary
| Measurement | Nepalese | Barbadian |
| Minimum | 49.8% | 5.2% |
| Maximum | 83.8% | 100.0% |
| Range | 33.9% | 94.8% |
| Mean | 64.1% | 46.2% |
| Median | 62.5% | 48.8% |
| Interquartile 25% (IQ1) | 58.6% | 35.8% |
| Interquartile 75% (IQ3) | 69.3% | 55.4% |
| Interquartile Range (IQR) | 10.7% | 19.6% |
| Standard Deviation (Sample) | 7.3% | 18.2% |
| Standard Deviation (Population) | 7.2% | 18.0% |
Similar Demographics by 2 or more Vehicles in Household
Demographics Similar to Nepalese by 2 or more Vehicles in Household
In terms of 2 or more vehicles in household, the demographic groups most similar to Nepalese are Native Hawaiian (61.4%, a difference of 0.020%), Czech (61.5%, a difference of 0.090%), Basque (61.4%, a difference of 0.090%), European (61.4%, a difference of 0.10%), and Samoan (61.5%, a difference of 0.14%).
| Demographics | Rating | Rank | 2 or more Vehicles in Household |
| English | 100.0 /100 | #8 | Exceptional 61.9% |
| Swedes | 100.0 /100 | #9 | Exceptional 61.8% |
| Mexicans | 100.0 /100 | #10 | Exceptional 61.7% |
| Dutch | 100.0 /100 | #11 | Exceptional 61.6% |
| Germans | 100.0 /100 | #12 | Exceptional 61.6% |
| Samoans | 100.0 /100 | #13 | Exceptional 61.5% |
| Czechs | 100.0 /100 | #14 | Exceptional 61.5% |
| Nepalese | 100.0 /100 | #15 | Exceptional 61.4% |
| Native Hawaiians | 100.0 /100 | #16 | Exceptional 61.4% |
| Basques | 100.0 /100 | #17 | Exceptional 61.4% |
| Europeans | 100.0 /100 | #18 | Exceptional 61.4% |
| Scottish | 100.0 /100 | #19 | Exceptional 61.2% |
| Sri Lankans | 100.0 /100 | #20 | Exceptional 61.0% |
| Koreans | 100.0 /100 | #21 | Exceptional 61.0% |
| Swiss | 100.0 /100 | #22 | Exceptional 61.0% |
Demographics Similar to Barbadians by 2 or more Vehicles in Household
In terms of 2 or more vehicles in household, the demographic groups most similar to Barbadians are Vietnamese (38.5%, a difference of 0.41%), Immigrants from Bangladesh (38.8%, a difference of 1.1%), Immigrants from Uzbekistan (37.9%, a difference of 1.2%), Immigrants from Trinidad and Tobago (40.3%, a difference of 5.0%), and Immigrants from Ecuador (40.5%, a difference of 5.6%).
| Demographics | Rating | Rank | 2 or more Vehicles in Household |
| Immigrants | Dominica | 0.0 /100 | #330 | Tragic 41.6% |
| West Indians | 0.0 /100 | #331 | Tragic 41.3% |
| Trinidadians and Tobagonians | 0.0 /100 | #332 | Tragic 40.9% |
| Immigrants | Ecuador | 0.0 /100 | #333 | Tragic 40.5% |
| Immigrants | Trinidad and Tobago | 0.0 /100 | #334 | Tragic 40.3% |
| Immigrants | Bangladesh | 0.0 /100 | #335 | Tragic 38.8% |
| Vietnamese | 0.0 /100 | #336 | Tragic 38.5% |
| Barbadians | 0.0 /100 | #337 | Tragic 38.3% |
| Immigrants | Uzbekistan | 0.0 /100 | #338 | Tragic 37.9% |
| Immigrants | Barbados | 0.0 /100 | #339 | Tragic 35.8% |
| British West Indians | 0.0 /100 | #340 | Tragic 35.4% |
| Guyanese | 0.0 /100 | #341 | Tragic 35.4% |
| Dominicans | 0.0 /100 | #342 | Tragic 35.3% |
| Immigrants | Guyana | 0.0 /100 | #343 | Tragic 35.0% |
| Yup'ik | 0.0 /100 | #344 | Tragic 34.9% |