Nepalese vs Immigrants from Afghanistan 2 or more Vehicles in Household
COMPARE
Nepalese
Immigrants from Afghanistan
2 or more Vehicles in Household
2 or more Vehicles in Household Comparison
Nepalese
Immigrants from Afghanistan
61.4%
2 OR MORE VEHICLES IN HOUSEHOLD
100.0/ 100
METRIC RATING
15th/ 347
METRIC RANK
58.3%
2 OR MORE VEHICLES IN HOUSEHOLD
99.6/ 100
METRIC RATING
74th/ 347
METRIC RANK
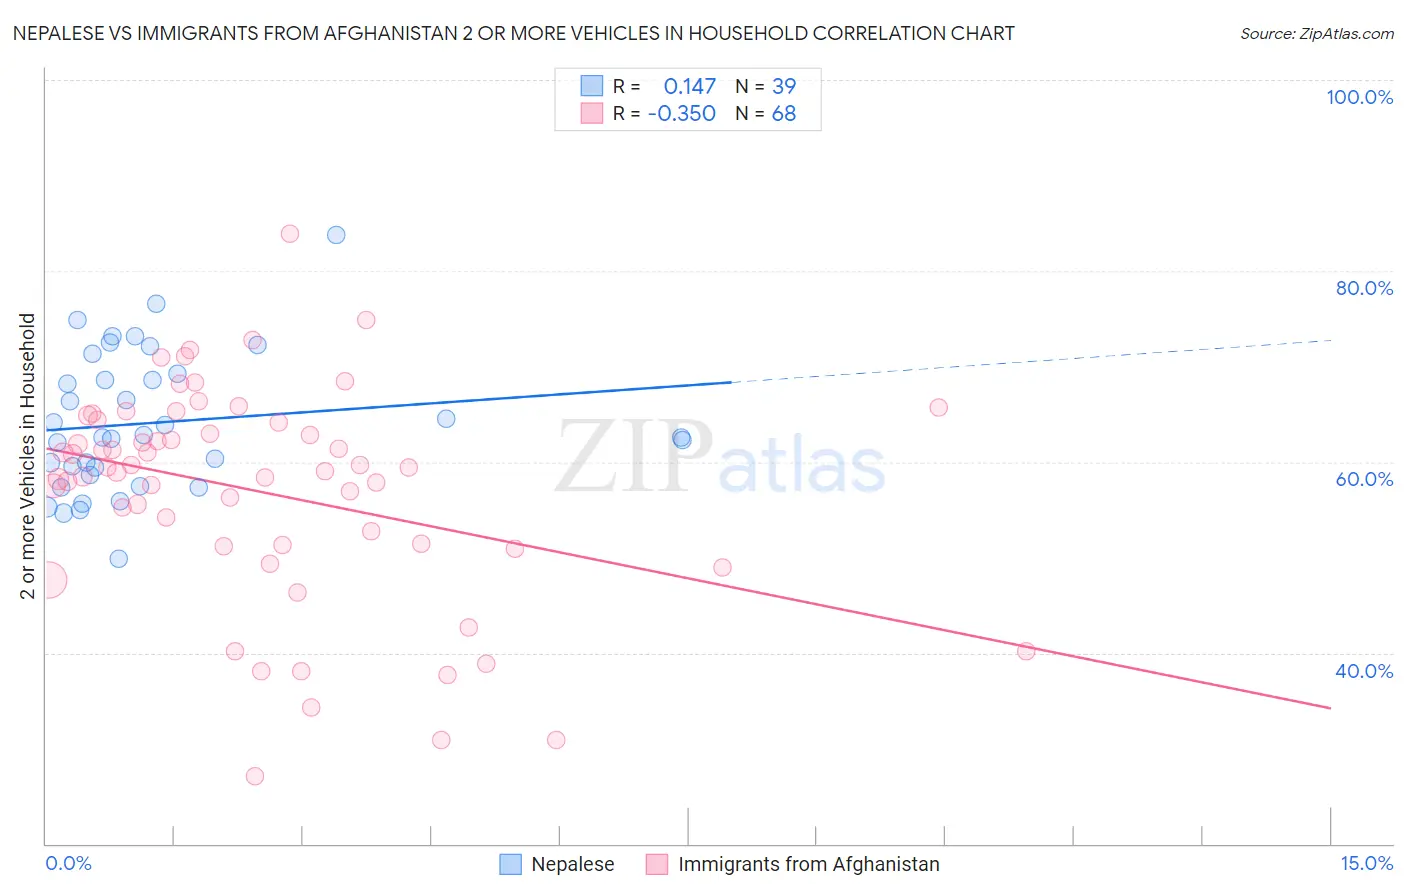
Nepalese vs Immigrants from Afghanistan 2 or more Vehicles in Household Correlation Chart
The statistical analysis conducted on geographies consisting of 24,483,296 people shows a poor positive correlation between the proportion of Nepalese and percentage of households with 2 or more vehicles available in the United States with a correlation coefficient (R) of 0.147 and weighted average of 61.4%. Similarly, the statistical analysis conducted on geographies consisting of 147,637,495 people shows a mild negative correlation between the proportion of Immigrants from Afghanistan and percentage of households with 2 or more vehicles available in the United States with a correlation coefficient (R) of -0.350 and weighted average of 58.3%, a difference of 5.3%.
2 or more Vehicles in Household Correlation Summary
| Measurement | Nepalese | Immigrants from Afghanistan |
| Minimum | 49.8% | 27.1% |
| Maximum | 83.8% | 83.9% |
| Range | 33.9% | 56.8% |
| Mean | 64.1% | 56.9% |
| Median | 62.5% | 59.2% |
| Interquartile 25% (IQ1) | 58.6% | 51.2% |
| Interquartile 75% (IQ3) | 69.3% | 64.3% |
| Interquartile Range (IQR) | 10.7% | 13.0% |
| Standard Deviation (Sample) | 7.3% | 11.4% |
| Standard Deviation (Population) | 7.2% | 11.3% |
Similar Demographics by 2 or more Vehicles in Household
Demographics Similar to Nepalese by 2 or more Vehicles in Household
In terms of 2 or more vehicles in household, the demographic groups most similar to Nepalese are Native Hawaiian (61.4%, a difference of 0.020%), Czech (61.5%, a difference of 0.090%), Basque (61.4%, a difference of 0.090%), European (61.4%, a difference of 0.10%), and Samoan (61.5%, a difference of 0.14%).
| Demographics | Rating | Rank | 2 or more Vehicles in Household |
| English | 100.0 /100 | #8 | Exceptional 61.9% |
| Swedes | 100.0 /100 | #9 | Exceptional 61.8% |
| Mexicans | 100.0 /100 | #10 | Exceptional 61.7% |
| Dutch | 100.0 /100 | #11 | Exceptional 61.6% |
| Germans | 100.0 /100 | #12 | Exceptional 61.6% |
| Samoans | 100.0 /100 | #13 | Exceptional 61.5% |
| Czechs | 100.0 /100 | #14 | Exceptional 61.5% |
| Nepalese | 100.0 /100 | #15 | Exceptional 61.4% |
| Native Hawaiians | 100.0 /100 | #16 | Exceptional 61.4% |
| Basques | 100.0 /100 | #17 | Exceptional 61.4% |
| Europeans | 100.0 /100 | #18 | Exceptional 61.4% |
| Scottish | 100.0 /100 | #19 | Exceptional 61.2% |
| Sri Lankans | 100.0 /100 | #20 | Exceptional 61.0% |
| Koreans | 100.0 /100 | #21 | Exceptional 61.0% |
| Swiss | 100.0 /100 | #22 | Exceptional 61.0% |
Demographics Similar to Immigrants from Afghanistan by 2 or more Vehicles in Household
In terms of 2 or more vehicles in household, the demographic groups most similar to Immigrants from Afghanistan are Bolivian (58.3%, a difference of 0.0%), Polish (58.3%, a difference of 0.080%), Creek (58.3%, a difference of 0.11%), Slovene (58.3%, a difference of 0.12%), and Austrian (58.4%, a difference of 0.13%).
| Demographics | Rating | Rank | 2 or more Vehicles in Household |
| Laotians | 99.7 /100 | #67 | Exceptional 58.6% |
| Canadians | 99.7 /100 | #68 | Exceptional 58.6% |
| Pennsylvania Germans | 99.7 /100 | #69 | Exceptional 58.5% |
| Italians | 99.6 /100 | #70 | Exceptional 58.4% |
| Bangladeshis | 99.6 /100 | #71 | Exceptional 58.4% |
| Austrians | 99.6 /100 | #72 | Exceptional 58.4% |
| Bolivians | 99.6 /100 | #73 | Exceptional 58.3% |
| Immigrants | Afghanistan | 99.6 /100 | #74 | Exceptional 58.3% |
| Poles | 99.5 /100 | #75 | Exceptional 58.3% |
| Creek | 99.5 /100 | #76 | Exceptional 58.3% |
| Slovenes | 99.5 /100 | #77 | Exceptional 58.3% |
| Lithuanians | 99.5 /100 | #78 | Exceptional 58.2% |
| Delaware | 99.4 /100 | #79 | Exceptional 58.2% |
| Immigrants | England | 99.3 /100 | #80 | Exceptional 58.1% |
| Immigrants | Iraq | 99.3 /100 | #81 | Exceptional 58.1% |