Nepalese vs Aleut 6th Grade
COMPARE
Nepalese
Aleut
6th Grade
6th Grade Comparison
Nepalese
Aleuts
94.9%
6TH GRADE
0.0/ 100
METRIC RATING
330th/ 347
METRIC RANK
97.7%
6TH GRADE
99.8/ 100
METRIC RATING
55th/ 347
METRIC RANK
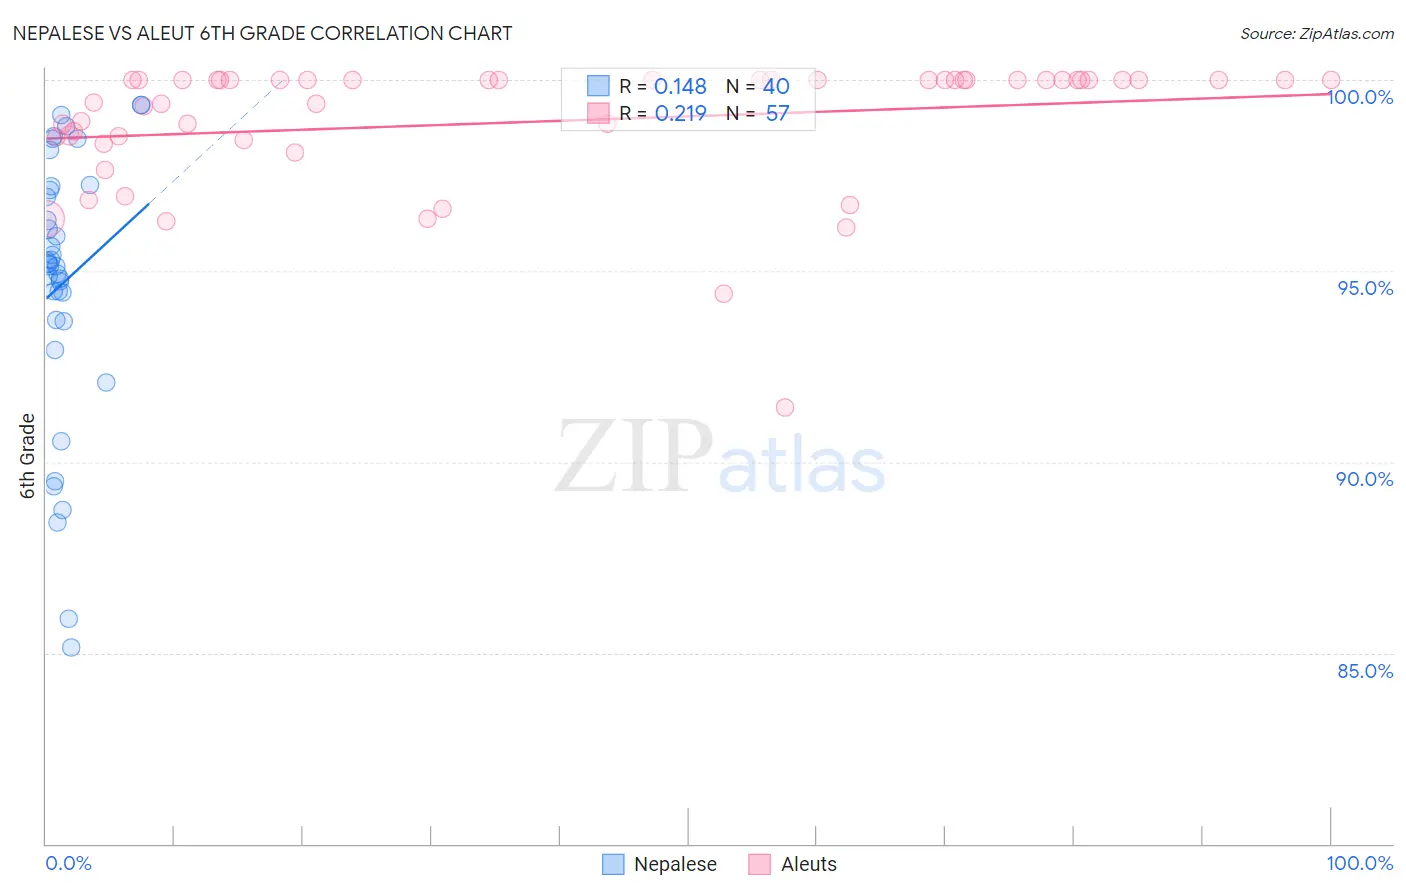
Nepalese vs Aleut 6th Grade Correlation Chart
The statistical analysis conducted on geographies consisting of 24,521,755 people shows a poor positive correlation between the proportion of Nepalese and percentage of population with at least 6th grade education in the United States with a correlation coefficient (R) of 0.148 and weighted average of 94.9%. Similarly, the statistical analysis conducted on geographies consisting of 61,781,058 people shows a weak positive correlation between the proportion of Aleuts and percentage of population with at least 6th grade education in the United States with a correlation coefficient (R) of 0.219 and weighted average of 97.7%, a difference of 3.0%.
6th Grade Correlation Summary
| Measurement | Nepalese | Aleut |
| Minimum | 85.1% | 91.4% |
| Maximum | 99.3% | 100.0% |
| Range | 14.2% | 8.6% |
| Mean | 94.7% | 98.9% |
| Median | 95.2% | 100.0% |
| Interquartile 25% (IQ1) | 93.7% | 98.5% |
| Interquartile 75% (IQ3) | 97.2% | 100.0% |
| Interquartile Range (IQR) | 3.5% | 1.5% |
| Standard Deviation (Sample) | 3.6% | 1.7% |
| Standard Deviation (Population) | 3.5% | 1.7% |
Similar Demographics by 6th Grade
Demographics Similar to Nepalese by 6th Grade
In terms of 6th grade, the demographic groups most similar to Nepalese are Immigrants from Armenia (94.9%, a difference of 0.010%), Dominican (94.9%, a difference of 0.070%), Immigrants from Honduras (94.8%, a difference of 0.11%), Mexican American Indian (95.0%, a difference of 0.14%), and Honduran (95.0%, a difference of 0.14%).
| Demographics | Rating | Rank | 6th Grade |
| Central American Indians | 0.0 /100 | #323 | Tragic 95.1% |
| Cape Verdeans | 0.0 /100 | #324 | Tragic 95.1% |
| Immigrants | Nicaragua | 0.0 /100 | #325 | Tragic 95.1% |
| Hispanics or Latinos | 0.0 /100 | #326 | Tragic 95.0% |
| Mexican American Indians | 0.0 /100 | #327 | Tragic 95.0% |
| Hondurans | 0.0 /100 | #328 | Tragic 95.0% |
| Dominicans | 0.0 /100 | #329 | Tragic 94.9% |
| Nepalese | 0.0 /100 | #330 | Tragic 94.9% |
| Immigrants | Armenia | 0.0 /100 | #331 | Tragic 94.9% |
| Immigrants | Honduras | 0.0 /100 | #332 | Tragic 94.8% |
| Immigrants | Latin America | 0.0 /100 | #333 | Tragic 94.7% |
| Immigrants | Azores | 0.0 /100 | #334 | Tragic 94.7% |
| Mexicans | 0.0 /100 | #335 | Tragic 94.6% |
| Immigrants | Dominican Republic | 0.0 /100 | #336 | Tragic 94.6% |
| Central Americans | 0.0 /100 | #337 | Tragic 94.5% |
Demographics Similar to Aleuts by 6th Grade
In terms of 6th grade, the demographic groups most similar to Aleuts are Creek (97.7%, a difference of 0.0%), Maltese (97.8%, a difference of 0.010%), Australian (97.8%, a difference of 0.010%), Slavic (97.8%, a difference of 0.010%), and Austrian (97.7%, a difference of 0.010%).
| Demographics | Rating | Rank | 6th Grade |
| Celtics | 99.9 /100 | #48 | Exceptional 97.8% |
| Estonians | 99.8 /100 | #49 | Exceptional 97.8% |
| Immigrants | Scotland | 99.8 /100 | #50 | Exceptional 97.8% |
| Maltese | 99.8 /100 | #51 | Exceptional 97.8% |
| Australians | 99.8 /100 | #52 | Exceptional 97.8% |
| Slavs | 99.8 /100 | #53 | Exceptional 97.8% |
| Creek | 99.8 /100 | #54 | Exceptional 97.7% |
| Aleuts | 99.8 /100 | #55 | Exceptional 97.7% |
| Austrians | 99.8 /100 | #56 | Exceptional 97.7% |
| Whites/Caucasians | 99.8 /100 | #57 | Exceptional 97.7% |
| Greeks | 99.8 /100 | #58 | Exceptional 97.7% |
| Americans | 99.8 /100 | #59 | Exceptional 97.7% |
| Immigrants | Canada | 99.8 /100 | #60 | Exceptional 97.7% |
| Serbians | 99.7 /100 | #61 | Exceptional 97.7% |
| Immigrants | North America | 99.7 /100 | #62 | Exceptional 97.7% |