Nepalese vs Immigrants from Armenia 1 or more Vehicles in Household
COMPARE
Nepalese
Immigrants from Armenia
1 or more Vehicles in Household
1 or more Vehicles in Household Comparison
Nepalese
Immigrants from Armenia
92.6%
1 OR MORE VEHICLES IN HOUSEHOLD
100.0/ 100
METRIC RATING
23rd/ 347
METRIC RANK
89.4%
1 OR MORE VEHICLES IN HOUSEHOLD
31.8/ 100
METRIC RATING
195th/ 347
METRIC RANK
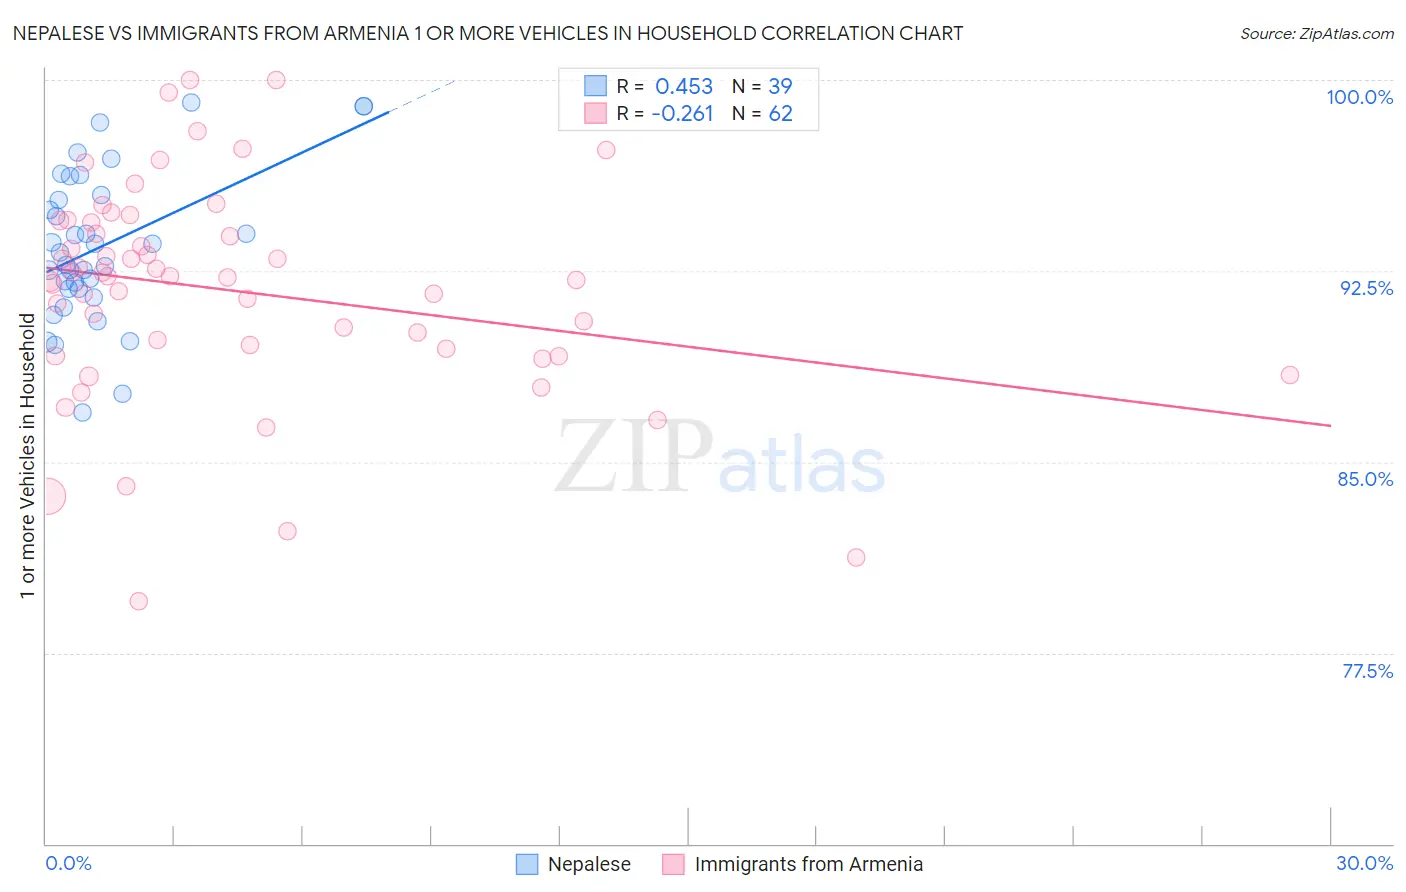
Nepalese vs Immigrants from Armenia 1 or more Vehicles in Household Correlation Chart
The statistical analysis conducted on geographies consisting of 24,483,296 people shows a moderate positive correlation between the proportion of Nepalese and percentage of households with 1 or more vehicles available in the United States with a correlation coefficient (R) of 0.453 and weighted average of 92.6%. Similarly, the statistical analysis conducted on geographies consisting of 97,564,455 people shows a weak negative correlation between the proportion of Immigrants from Armenia and percentage of households with 1 or more vehicles available in the United States with a correlation coefficient (R) of -0.261 and weighted average of 89.4%, a difference of 3.6%.
1 or more Vehicles in Household Correlation Summary
| Measurement | Nepalese | Immigrants from Armenia |
| Minimum | 86.9% | 79.5% |
| Maximum | 99.1% | 100.0% |
| Range | 12.2% | 20.5% |
| Mean | 93.5% | 91.7% |
| Median | 93.2% | 92.3% |
| Interquartile 25% (IQ1) | 91.8% | 89.4% |
| Interquartile 75% (IQ3) | 95.5% | 94.4% |
| Interquartile Range (IQR) | 3.7% | 5.0% |
| Standard Deviation (Sample) | 3.0% | 4.2% |
| Standard Deviation (Population) | 2.9% | 4.2% |
Similar Demographics by 1 or more Vehicles in Household
Demographics Similar to Nepalese by 1 or more Vehicles in Household
In terms of 1 or more vehicles in household, the demographic groups most similar to Nepalese are French (92.7%, a difference of 0.070%), Yaqui (92.6%, a difference of 0.070%), Ottawa (92.7%, a difference of 0.080%), Immigrants from Iraq (92.5%, a difference of 0.090%), and Arapaho (92.7%, a difference of 0.10%).
| Demographics | Rating | Rank | 1 or more Vehicles in Household |
| Assyrians/Chaldeans/Syriacs | 100.0 /100 | #16 | Exceptional 93.0% |
| Europeans | 100.0 /100 | #17 | Exceptional 93.0% |
| Welsh | 100.0 /100 | #18 | Exceptional 93.0% |
| Tongans | 100.0 /100 | #19 | Exceptional 92.9% |
| Arapaho | 100.0 /100 | #20 | Exceptional 92.7% |
| Ottawa | 100.0 /100 | #21 | Exceptional 92.7% |
| French | 100.0 /100 | #22 | Exceptional 92.7% |
| Nepalese | 100.0 /100 | #23 | Exceptional 92.6% |
| Yaqui | 100.0 /100 | #24 | Exceptional 92.6% |
| Immigrants | Iraq | 100.0 /100 | #25 | Exceptional 92.5% |
| British | 100.0 /100 | #26 | Exceptional 92.5% |
| Americans | 100.0 /100 | #27 | Exceptional 92.5% |
| Sri Lankans | 100.0 /100 | #28 | Exceptional 92.5% |
| Native Hawaiians | 100.0 /100 | #29 | Exceptional 92.4% |
| Finns | 100.0 /100 | #30 | Exceptional 92.4% |
Demographics Similar to Immigrants from Armenia by 1 or more Vehicles in Household
In terms of 1 or more vehicles in household, the demographic groups most similar to Immigrants from Armenia are Immigrants from Eritrea (89.4%, a difference of 0.020%), Immigrants from Northern Europe (89.5%, a difference of 0.060%), Immigrants from North Macedonia (89.5%, a difference of 0.080%), Immigrants from Poland (89.5%, a difference of 0.090%), and Carpatho Rusyn (89.5%, a difference of 0.10%).
| Demographics | Rating | Rank | 1 or more Vehicles in Household |
| Immigrants | Nepal | 38.9 /100 | #188 | Fair 89.5% |
| Carpatho Rusyns | 37.8 /100 | #189 | Fair 89.5% |
| Shoshone | 37.5 /100 | #190 | Fair 89.5% |
| Immigrants | Poland | 37.1 /100 | #191 | Fair 89.5% |
| Immigrants | North Macedonia | 36.5 /100 | #192 | Fair 89.5% |
| Immigrants | Northern Europe | 35.5 /100 | #193 | Fair 89.5% |
| Immigrants | Eritrea | 33.2 /100 | #194 | Fair 89.4% |
| Immigrants | Armenia | 31.8 /100 | #195 | Fair 89.4% |
| Crow | 24.3 /100 | #196 | Fair 89.3% |
| Immigrants | Sweden | 23.6 /100 | #197 | Fair 89.3% |
| Pennsylvania Germans | 22.9 /100 | #198 | Fair 89.3% |
| Immigrants | Asia | 22.8 /100 | #199 | Fair 89.3% |
| Central Americans | 21.4 /100 | #200 | Fair 89.2% |
| Immigrants | Western Europe | 20.5 /100 | #201 | Fair 89.2% |
| Iroquois | 19.8 /100 | #202 | Poor 89.2% |