Mexican vs Immigrants from Cabo Verde 2 or more Vehicles in Household
COMPARE
Mexican
Immigrants from Cabo Verde
2 or more Vehicles in Household
2 or more Vehicles in Household Comparison
Mexicans
Immigrants from Cabo Verde
61.7%
2 OR MORE VEHICLES IN HOUSEHOLD
100.0/ 100
METRIC RATING
10th/ 347
METRIC RANK
43.3%
2 OR MORE VEHICLES IN HOUSEHOLD
0.0/ 100
METRIC RATING
324th/ 347
METRIC RANK
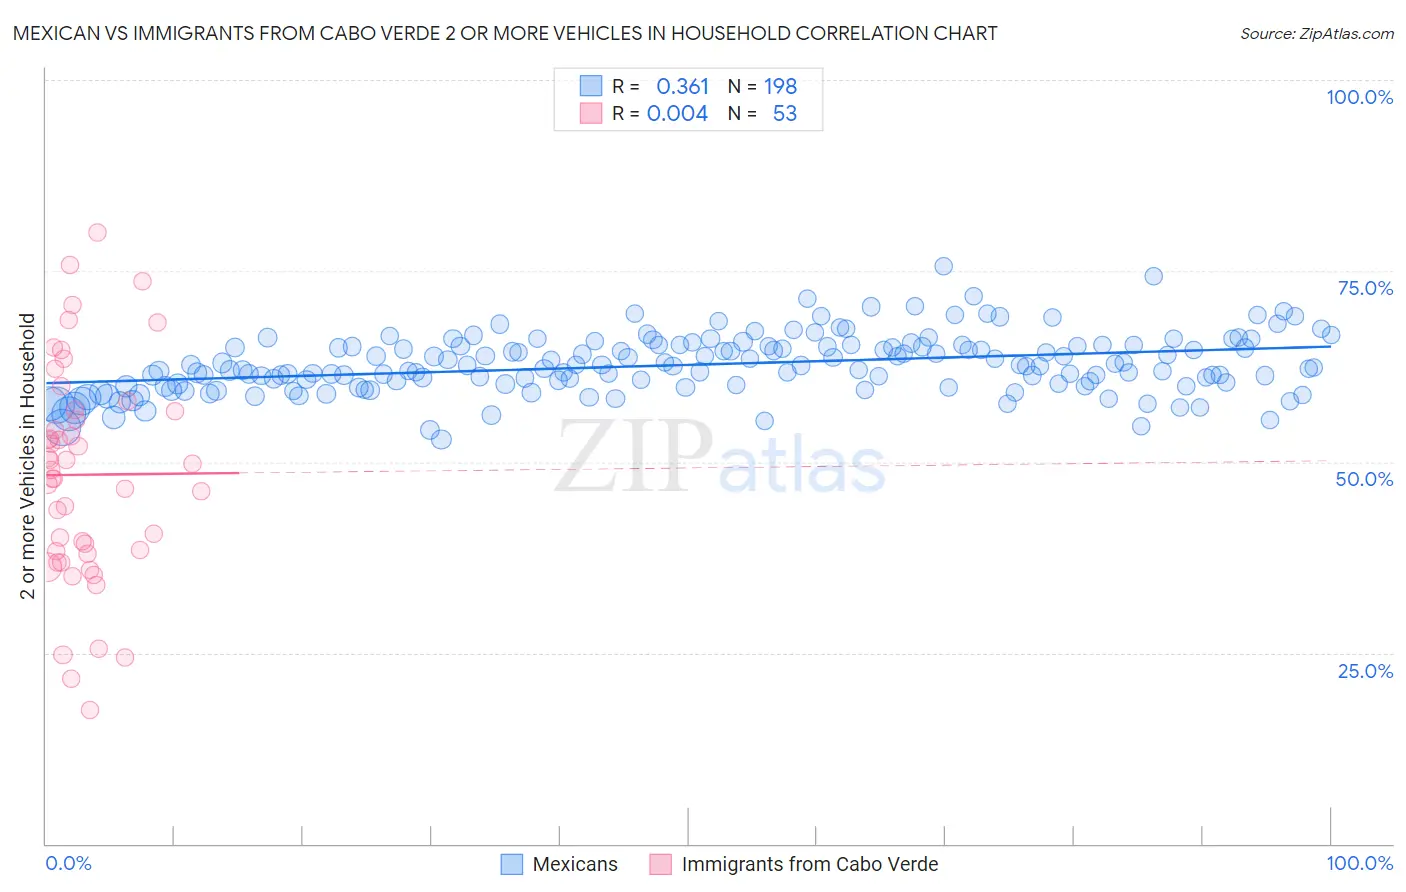
Mexican vs Immigrants from Cabo Verde 2 or more Vehicles in Household Correlation Chart
The statistical analysis conducted on geographies consisting of 536,751,978 people shows a mild positive correlation between the proportion of Mexicans and percentage of households with 2 or more vehicles available in the United States with a correlation coefficient (R) of 0.361 and weighted average of 61.7%. Similarly, the statistical analysis conducted on geographies consisting of 38,145,332 people shows no correlation between the proportion of Immigrants from Cabo Verde and percentage of households with 2 or more vehicles available in the United States with a correlation coefficient (R) of 0.004 and weighted average of 43.3%, a difference of 42.3%.
2 or more Vehicles in Household Correlation Summary
| Measurement | Mexican | Immigrants from Cabo Verde |
| Minimum | 52.9% | 17.5% |
| Maximum | 75.7% | 80.1% |
| Range | 22.7% | 62.6% |
| Mean | 62.7% | 48.3% |
| Median | 62.5% | 48.9% |
| Interquartile 25% (IQ1) | 60.0% | 38.1% |
| Interquartile 75% (IQ3) | 65.2% | 56.7% |
| Interquartile Range (IQR) | 5.2% | 18.6% |
| Standard Deviation (Sample) | 3.8% | 14.1% |
| Standard Deviation (Population) | 3.8% | 14.0% |
Similar Demographics by 2 or more Vehicles in Household
Demographics Similar to Mexicans by 2 or more Vehicles in Household
In terms of 2 or more vehicles in household, the demographic groups most similar to Mexicans are Dutch (61.6%, a difference of 0.050%), German (61.6%, a difference of 0.17%), Swedish (61.8%, a difference of 0.28%), Samoan (61.5%, a difference of 0.28%), and Czech (61.5%, a difference of 0.33%).
| Demographics | Rating | Rank | 2 or more Vehicles in Household |
| Danes | 100.0 /100 | #3 | Exceptional 63.3% |
| Norwegians | 100.0 /100 | #4 | Exceptional 62.8% |
| Immigrants | Fiji | 100.0 /100 | #5 | Exceptional 62.3% |
| Scandinavians | 100.0 /100 | #6 | Exceptional 62.1% |
| Puget Sound Salish | 100.0 /100 | #7 | Exceptional 62.1% |
| English | 100.0 /100 | #8 | Exceptional 61.9% |
| Swedes | 100.0 /100 | #9 | Exceptional 61.8% |
| Mexicans | 100.0 /100 | #10 | Exceptional 61.7% |
| Dutch | 100.0 /100 | #11 | Exceptional 61.6% |
| Germans | 100.0 /100 | #12 | Exceptional 61.6% |
| Samoans | 100.0 /100 | #13 | Exceptional 61.5% |
| Czechs | 100.0 /100 | #14 | Exceptional 61.5% |
| Nepalese | 100.0 /100 | #15 | Exceptional 61.4% |
| Native Hawaiians | 100.0 /100 | #16 | Exceptional 61.4% |
| Basques | 100.0 /100 | #17 | Exceptional 61.4% |
Demographics Similar to Immigrants from Cabo Verde by 2 or more Vehicles in Household
In terms of 2 or more vehicles in household, the demographic groups most similar to Immigrants from Cabo Verde are Immigrants from West Indies (43.1%, a difference of 0.57%), Immigrants from Senegal (43.0%, a difference of 0.72%), Immigrants from Yemen (42.8%, a difference of 1.1%), Inupiat (42.6%, a difference of 1.6%), and Immigrants from Caribbean (44.2%, a difference of 2.1%).
| Demographics | Rating | Rank | 2 or more Vehicles in Household |
| Immigrants | Haiti | 0.0 /100 | #317 | Tragic 46.5% |
| Immigrants | Albania | 0.0 /100 | #318 | Tragic 46.0% |
| Jamaicans | 0.0 /100 | #319 | Tragic 45.8% |
| Soviet Union | 0.0 /100 | #320 | Tragic 45.7% |
| Immigrants | Jamaica | 0.0 /100 | #321 | Tragic 44.5% |
| Senegalese | 0.0 /100 | #322 | Tragic 44.2% |
| Immigrants | Caribbean | 0.0 /100 | #323 | Tragic 44.2% |
| Immigrants | Cabo Verde | 0.0 /100 | #324 | Tragic 43.3% |
| Immigrants | West Indies | 0.0 /100 | #325 | Tragic 43.1% |
| Immigrants | Senegal | 0.0 /100 | #326 | Tragic 43.0% |
| Immigrants | Yemen | 0.0 /100 | #327 | Tragic 42.8% |
| Inupiat | 0.0 /100 | #328 | Tragic 42.6% |
| Ecuadorians | 0.0 /100 | #329 | Tragic 42.0% |
| Immigrants | Dominica | 0.0 /100 | #330 | Tragic 41.6% |
| West Indians | 0.0 /100 | #331 | Tragic 41.3% |