Maltese vs Immigrants from Canada 2 or more Vehicles in Household
COMPARE
Maltese
Immigrants from Canada
2 or more Vehicles in Household
2 or more Vehicles in Household Comparison
Maltese
Immigrants from Canada
58.0%
2 OR MORE VEHICLES IN HOUSEHOLD
99.2/ 100
METRIC RATING
84th/ 347
METRIC RANK
57.5%
2 OR MORE VEHICLES IN HOUSEHOLD
98.1/ 100
METRIC RATING
108th/ 347
METRIC RANK
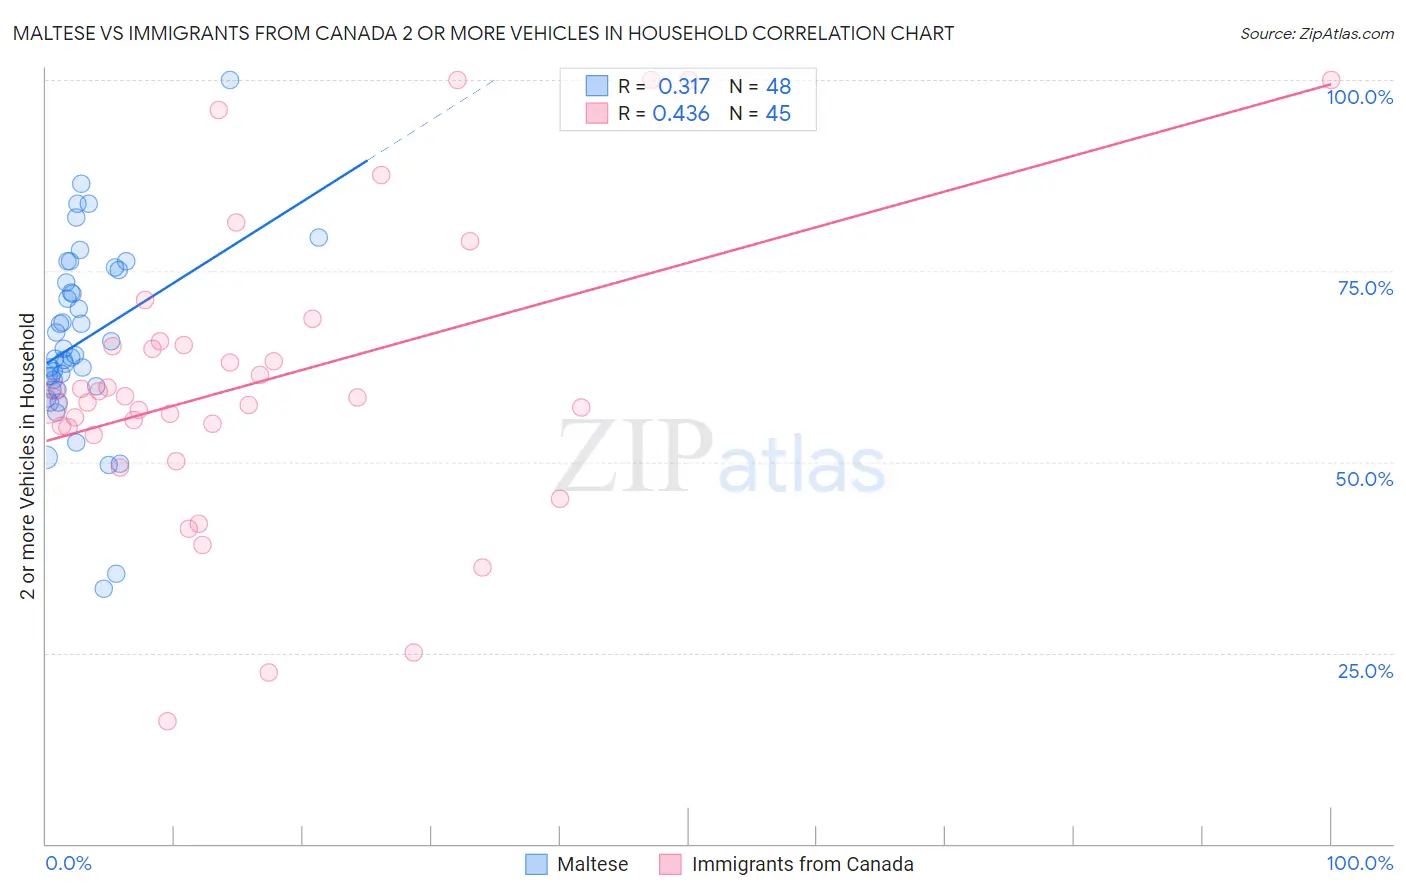
Maltese vs Immigrants from Canada 2 or more Vehicles in Household Correlation Chart
The statistical analysis conducted on geographies consisting of 126,441,738 people shows a mild positive correlation between the proportion of Maltese and percentage of households with 2 or more vehicles available in the United States with a correlation coefficient (R) of 0.317 and weighted average of 58.0%. Similarly, the statistical analysis conducted on geographies consisting of 459,158,975 people shows a moderate positive correlation between the proportion of Immigrants from Canada and percentage of households with 2 or more vehicles available in the United States with a correlation coefficient (R) of 0.436 and weighted average of 57.5%, a difference of 0.84%.
2 or more Vehicles in Household Correlation Summary
| Measurement | Maltese | Immigrants from Canada |
| Minimum | 33.3% | 16.0% |
| Maximum | 100.0% | 100.0% |
| Range | 66.7% | 84.0% |
| Mean | 65.9% | 60.6% |
| Median | 63.9% | 58.4% |
| Interquartile 25% (IQ1) | 59.7% | 54.1% |
| Interquartile 75% (IQ3) | 74.3% | 65.5% |
| Interquartile Range (IQR) | 14.6% | 11.4% |
| Standard Deviation (Sample) | 12.2% | 19.4% |
| Standard Deviation (Population) | 12.1% | 19.1% |
Similar Demographics by 2 or more Vehicles in Household
Demographics Similar to Maltese by 2 or more Vehicles in Household
In terms of 2 or more vehicles in household, the demographic groups most similar to Maltese are Icelander (58.0%, a difference of 0.030%), Slovak (58.0%, a difference of 0.050%), Iranian (58.1%, a difference of 0.070%), Potawatomi (58.0%, a difference of 0.080%), and Thai (57.9%, a difference of 0.12%).
| Demographics | Rating | Rank | 2 or more Vehicles in Household |
| Slovenes | 99.5 /100 | #77 | Exceptional 58.3% |
| Lithuanians | 99.5 /100 | #78 | Exceptional 58.2% |
| Delaware | 99.4 /100 | #79 | Exceptional 58.2% |
| Immigrants | England | 99.3 /100 | #80 | Exceptional 58.1% |
| Immigrants | Iraq | 99.3 /100 | #81 | Exceptional 58.1% |
| Iranians | 99.3 /100 | #82 | Exceptional 58.1% |
| Icelanders | 99.2 /100 | #83 | Exceptional 58.0% |
| Maltese | 99.2 /100 | #84 | Exceptional 58.0% |
| Slovaks | 99.2 /100 | #85 | Exceptional 58.0% |
| Potawatomi | 99.1 /100 | #86 | Exceptional 58.0% |
| Thais | 99.1 /100 | #87 | Exceptional 57.9% |
| Immigrants | Iran | 99.1 /100 | #88 | Exceptional 57.9% |
| Immigrants | Germany | 99.0 /100 | #89 | Exceptional 57.9% |
| Hispanics or Latinos | 99.0 /100 | #90 | Exceptional 57.9% |
| Pakistanis | 99.0 /100 | #91 | Exceptional 57.9% |
Demographics Similar to Immigrants from Canada by 2 or more Vehicles in Household
In terms of 2 or more vehicles in household, the demographic groups most similar to Immigrants from Canada are Immigrants from Netherlands (57.5%, a difference of 0.010%), Immigrants from Oceania (57.5%, a difference of 0.030%), Immigrants from North America (57.5%, a difference of 0.030%), Immigrants from Bolivia (57.6%, a difference of 0.050%), and Jordanian (57.6%, a difference of 0.050%).
| Demographics | Rating | Rank | 2 or more Vehicles in Household |
| Lebanese | 98.3 /100 | #101 | Exceptional 57.6% |
| Immigrants | Bolivia | 98.2 /100 | #102 | Exceptional 57.6% |
| Jordanians | 98.2 /100 | #103 | Exceptional 57.6% |
| Immigrants | Indonesia | 98.2 /100 | #104 | Exceptional 57.6% |
| Immigrants | Korea | 98.2 /100 | #105 | Exceptional 57.6% |
| Immigrants | Oceania | 98.2 /100 | #106 | Exceptional 57.5% |
| Immigrants | Netherlands | 98.2 /100 | #107 | Exceptional 57.5% |
| Immigrants | Canada | 98.1 /100 | #108 | Exceptional 57.5% |
| Immigrants | North America | 98.1 /100 | #109 | Exceptional 57.5% |
| Japanese | 98.0 /100 | #110 | Exceptional 57.5% |
| Greeks | 98.0 /100 | #111 | Exceptional 57.5% |
| Pueblo | 98.0 /100 | #112 | Exceptional 57.5% |
| Zimbabweans | 96.9 /100 | #113 | Exceptional 57.2% |
| Immigrants | Lebanon | 96.8 /100 | #114 | Exceptional 57.2% |
| Chippewa | 96.6 /100 | #115 | Exceptional 57.2% |