Maltese vs Nicaraguan Unemployment Among Youth under 25 years
COMPARE
Maltese
Nicaraguan
Unemployment Among Youth under 25 years
Unemployment Among Youth under 25 years Comparison
Maltese
Nicaraguans
11.7%
UNEMPLOYMENT AMONG YOUTH UNDER 25 YEARS
33.9/ 100
METRIC RATING
186th/ 347
METRIC RANK
11.3%
UNEMPLOYMENT AMONG YOUTH UNDER 25 YEARS
94.3/ 100
METRIC RATING
97th/ 347
METRIC RANK
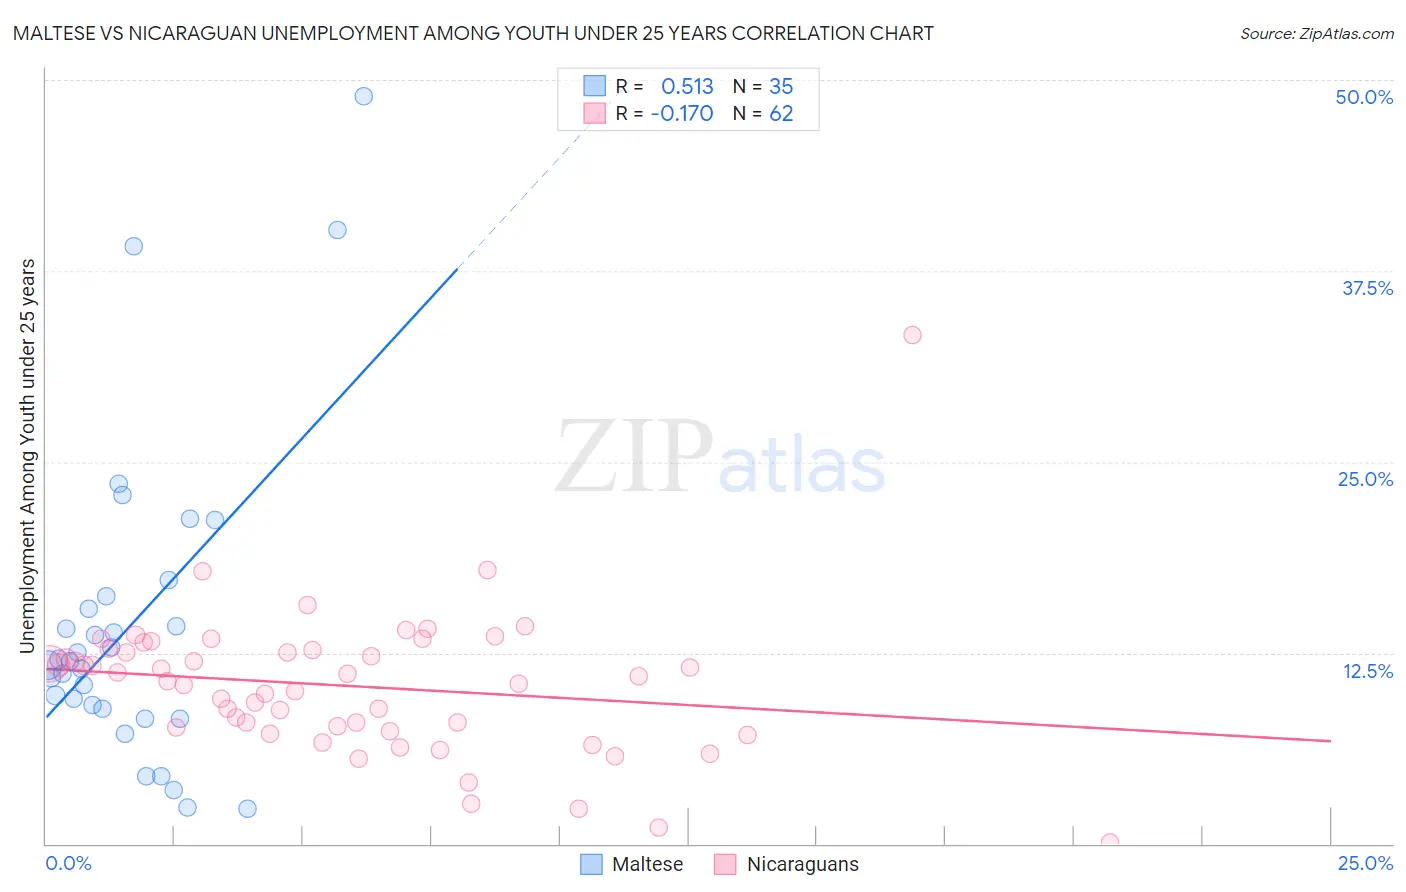
Maltese vs Nicaraguan Unemployment Among Youth under 25 years Correlation Chart
The statistical analysis conducted on geographies consisting of 125,852,154 people shows a substantial positive correlation between the proportion of Maltese and unemployment rate among youth under the age of 25 in the United States with a correlation coefficient (R) of 0.513 and weighted average of 11.7%. Similarly, the statistical analysis conducted on geographies consisting of 284,206,393 people shows a poor negative correlation between the proportion of Nicaraguans and unemployment rate among youth under the age of 25 in the United States with a correlation coefficient (R) of -0.170 and weighted average of 11.3%, a difference of 3.7%.
Unemployment Among Youth under 25 years Correlation Summary
| Measurement | Maltese | Nicaraguan |
| Minimum | 2.3% | 0.10% |
| Maximum | 48.9% | 33.3% |
| Range | 46.6% | 33.2% |
| Mean | 14.4% | 10.3% |
| Median | 12.0% | 10.8% |
| Interquartile 25% (IQ1) | 8.8% | 7.6% |
| Interquartile 75% (IQ3) | 16.2% | 12.7% |
| Interquartile Range (IQR) | 7.4% | 5.1% |
| Standard Deviation (Sample) | 10.4% | 4.8% |
| Standard Deviation (Population) | 10.2% | 4.7% |
Similar Demographics by Unemployment Among Youth under 25 years
Demographics Similar to Maltese by Unemployment Among Youth under 25 years
In terms of unemployment among youth under 25 years, the demographic groups most similar to Maltese are French American Indian (11.7%, a difference of 0.0%), Immigrants from Eastern Europe (11.7%, a difference of 0.010%), American (11.7%, a difference of 0.030%), Immigrants from Egypt (11.7%, a difference of 0.090%), and Immigrants from Italy (11.7%, a difference of 0.10%).
| Demographics | Rating | Rank | Unemployment Among Youth under 25 years |
| Immigrants | Hong Kong | 42.4 /100 | #179 | Average 11.6% |
| Spaniards | 39.8 /100 | #180 | Fair 11.7% |
| Syrians | 38.4 /100 | #181 | Fair 11.7% |
| Immigrants | Italy | 36.2 /100 | #182 | Fair 11.7% |
| Americans | 34.5 /100 | #183 | Fair 11.7% |
| Immigrants | Eastern Europe | 34.1 /100 | #184 | Fair 11.7% |
| French American Indians | 34.0 /100 | #185 | Fair 11.7% |
| Maltese | 33.9 /100 | #186 | Fair 11.7% |
| Immigrants | Egypt | 31.9 /100 | #187 | Fair 11.7% |
| Immigrants | Poland | 31.4 /100 | #188 | Fair 11.7% |
| Japanese | 30.8 /100 | #189 | Fair 11.7% |
| Portuguese | 30.3 /100 | #190 | Fair 11.7% |
| Cypriots | 28.5 /100 | #191 | Fair 11.7% |
| Immigrants | Russia | 28.5 /100 | #192 | Fair 11.7% |
| Seminole | 27.9 /100 | #193 | Fair 11.7% |
Demographics Similar to Nicaraguans by Unemployment Among Youth under 25 years
In terms of unemployment among youth under 25 years, the demographic groups most similar to Nicaraguans are Estonian (11.3%, a difference of 0.0%), Immigrants from Serbia (11.3%, a difference of 0.020%), Carpatho Rusyn (11.3%, a difference of 0.030%), Celtic (11.3%, a difference of 0.050%), and Pakistani (11.3%, a difference of 0.060%).
| Demographics | Rating | Rank | Unemployment Among Youth under 25 years |
| Immigrants | Bolivia | 95.5 /100 | #90 | Exceptional 11.2% |
| Immigrants | Taiwan | 95.1 /100 | #91 | Exceptional 11.2% |
| Immigrants | Latvia | 95.1 /100 | #92 | Exceptional 11.2% |
| Immigrants | North America | 95.1 /100 | #93 | Exceptional 11.2% |
| Lithuanians | 94.8 /100 | #94 | Exceptional 11.3% |
| Carpatho Rusyns | 94.4 /100 | #95 | Exceptional 11.3% |
| Immigrants | Serbia | 94.4 /100 | #96 | Exceptional 11.3% |
| Nicaraguans | 94.3 /100 | #97 | Exceptional 11.3% |
| Estonians | 94.2 /100 | #98 | Exceptional 11.3% |
| Celtics | 94.0 /100 | #99 | Exceptional 11.3% |
| Pakistanis | 94.0 /100 | #100 | Exceptional 11.3% |
| Iroquois | 93.8 /100 | #101 | Exceptional 11.3% |
| Immigrants | Thailand | 93.6 /100 | #102 | Exceptional 11.3% |
| Immigrants | Malaysia | 93.6 /100 | #103 | Exceptional 11.3% |
| Immigrants | Afghanistan | 93.4 /100 | #104 | Exceptional 11.3% |