Maltese vs Immigrants from Cabo Verde 2 or more Vehicles in Household
COMPARE
Maltese
Immigrants from Cabo Verde
2 or more Vehicles in Household
2 or more Vehicles in Household Comparison
Maltese
Immigrants from Cabo Verde
58.0%
2 OR MORE VEHICLES IN HOUSEHOLD
99.2/ 100
METRIC RATING
84th/ 347
METRIC RANK
43.3%
2 OR MORE VEHICLES IN HOUSEHOLD
0.0/ 100
METRIC RATING
324th/ 347
METRIC RANK
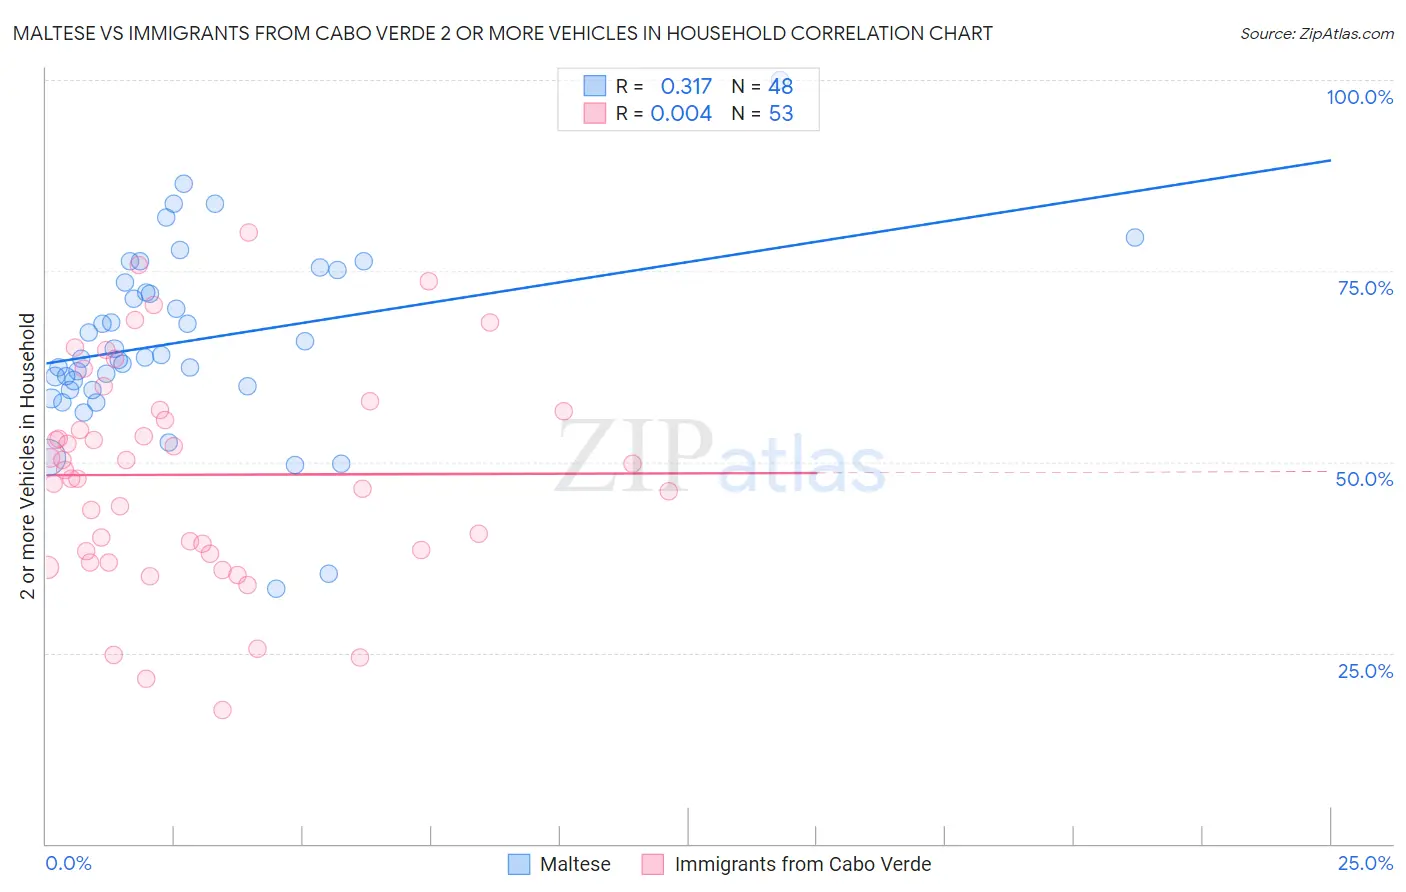
Maltese vs Immigrants from Cabo Verde 2 or more Vehicles in Household Correlation Chart
The statistical analysis conducted on geographies consisting of 126,441,738 people shows a mild positive correlation between the proportion of Maltese and percentage of households with 2 or more vehicles available in the United States with a correlation coefficient (R) of 0.317 and weighted average of 58.0%. Similarly, the statistical analysis conducted on geographies consisting of 38,145,332 people shows no correlation between the proportion of Immigrants from Cabo Verde and percentage of households with 2 or more vehicles available in the United States with a correlation coefficient (R) of 0.004 and weighted average of 43.3%, a difference of 33.9%.
2 or more Vehicles in Household Correlation Summary
| Measurement | Maltese | Immigrants from Cabo Verde |
| Minimum | 33.3% | 17.5% |
| Maximum | 100.0% | 80.1% |
| Range | 66.7% | 62.6% |
| Mean | 65.9% | 48.3% |
| Median | 63.9% | 48.9% |
| Interquartile 25% (IQ1) | 59.7% | 38.1% |
| Interquartile 75% (IQ3) | 74.3% | 56.7% |
| Interquartile Range (IQR) | 14.6% | 18.6% |
| Standard Deviation (Sample) | 12.2% | 14.1% |
| Standard Deviation (Population) | 12.1% | 14.0% |
Similar Demographics by 2 or more Vehicles in Household
Demographics Similar to Maltese by 2 or more Vehicles in Household
In terms of 2 or more vehicles in household, the demographic groups most similar to Maltese are Icelander (58.0%, a difference of 0.030%), Slovak (58.0%, a difference of 0.050%), Iranian (58.1%, a difference of 0.070%), Potawatomi (58.0%, a difference of 0.080%), and Thai (57.9%, a difference of 0.12%).
| Demographics | Rating | Rank | 2 or more Vehicles in Household |
| Slovenes | 99.5 /100 | #77 | Exceptional 58.3% |
| Lithuanians | 99.5 /100 | #78 | Exceptional 58.2% |
| Delaware | 99.4 /100 | #79 | Exceptional 58.2% |
| Immigrants | England | 99.3 /100 | #80 | Exceptional 58.1% |
| Immigrants | Iraq | 99.3 /100 | #81 | Exceptional 58.1% |
| Iranians | 99.3 /100 | #82 | Exceptional 58.1% |
| Icelanders | 99.2 /100 | #83 | Exceptional 58.0% |
| Maltese | 99.2 /100 | #84 | Exceptional 58.0% |
| Slovaks | 99.2 /100 | #85 | Exceptional 58.0% |
| Potawatomi | 99.1 /100 | #86 | Exceptional 58.0% |
| Thais | 99.1 /100 | #87 | Exceptional 57.9% |
| Immigrants | Iran | 99.1 /100 | #88 | Exceptional 57.9% |
| Immigrants | Germany | 99.0 /100 | #89 | Exceptional 57.9% |
| Hispanics or Latinos | 99.0 /100 | #90 | Exceptional 57.9% |
| Pakistanis | 99.0 /100 | #91 | Exceptional 57.9% |
Demographics Similar to Immigrants from Cabo Verde by 2 or more Vehicles in Household
In terms of 2 or more vehicles in household, the demographic groups most similar to Immigrants from Cabo Verde are Immigrants from West Indies (43.1%, a difference of 0.57%), Immigrants from Senegal (43.0%, a difference of 0.72%), Immigrants from Yemen (42.8%, a difference of 1.1%), Inupiat (42.6%, a difference of 1.6%), and Immigrants from Caribbean (44.2%, a difference of 2.1%).
| Demographics | Rating | Rank | 2 or more Vehicles in Household |
| Immigrants | Haiti | 0.0 /100 | #317 | Tragic 46.5% |
| Immigrants | Albania | 0.0 /100 | #318 | Tragic 46.0% |
| Jamaicans | 0.0 /100 | #319 | Tragic 45.8% |
| Soviet Union | 0.0 /100 | #320 | Tragic 45.7% |
| Immigrants | Jamaica | 0.0 /100 | #321 | Tragic 44.5% |
| Senegalese | 0.0 /100 | #322 | Tragic 44.2% |
| Immigrants | Caribbean | 0.0 /100 | #323 | Tragic 44.2% |
| Immigrants | Cabo Verde | 0.0 /100 | #324 | Tragic 43.3% |
| Immigrants | West Indies | 0.0 /100 | #325 | Tragic 43.1% |
| Immigrants | Senegal | 0.0 /100 | #326 | Tragic 43.0% |
| Immigrants | Yemen | 0.0 /100 | #327 | Tragic 42.8% |
| Inupiat | 0.0 /100 | #328 | Tragic 42.6% |
| Ecuadorians | 0.0 /100 | #329 | Tragic 42.0% |
| Immigrants | Dominica | 0.0 /100 | #330 | Tragic 41.6% |
| West Indians | 0.0 /100 | #331 | Tragic 41.3% |