Macedonian vs Filipino 2 or more Vehicles in Household
COMPARE
Macedonian
Filipino
2 or more Vehicles in Household
2 or more Vehicles in Household Comparison
Macedonians
Filipinos
53.3%
2 OR MORE VEHICLES IN HOUSEHOLD
2.4/ 100
METRIC RATING
237th/ 347
METRIC RANK
57.8%
2 OR MORE VEHICLES IN HOUSEHOLD
98.9/ 100
METRIC RATING
94th/ 347
METRIC RANK
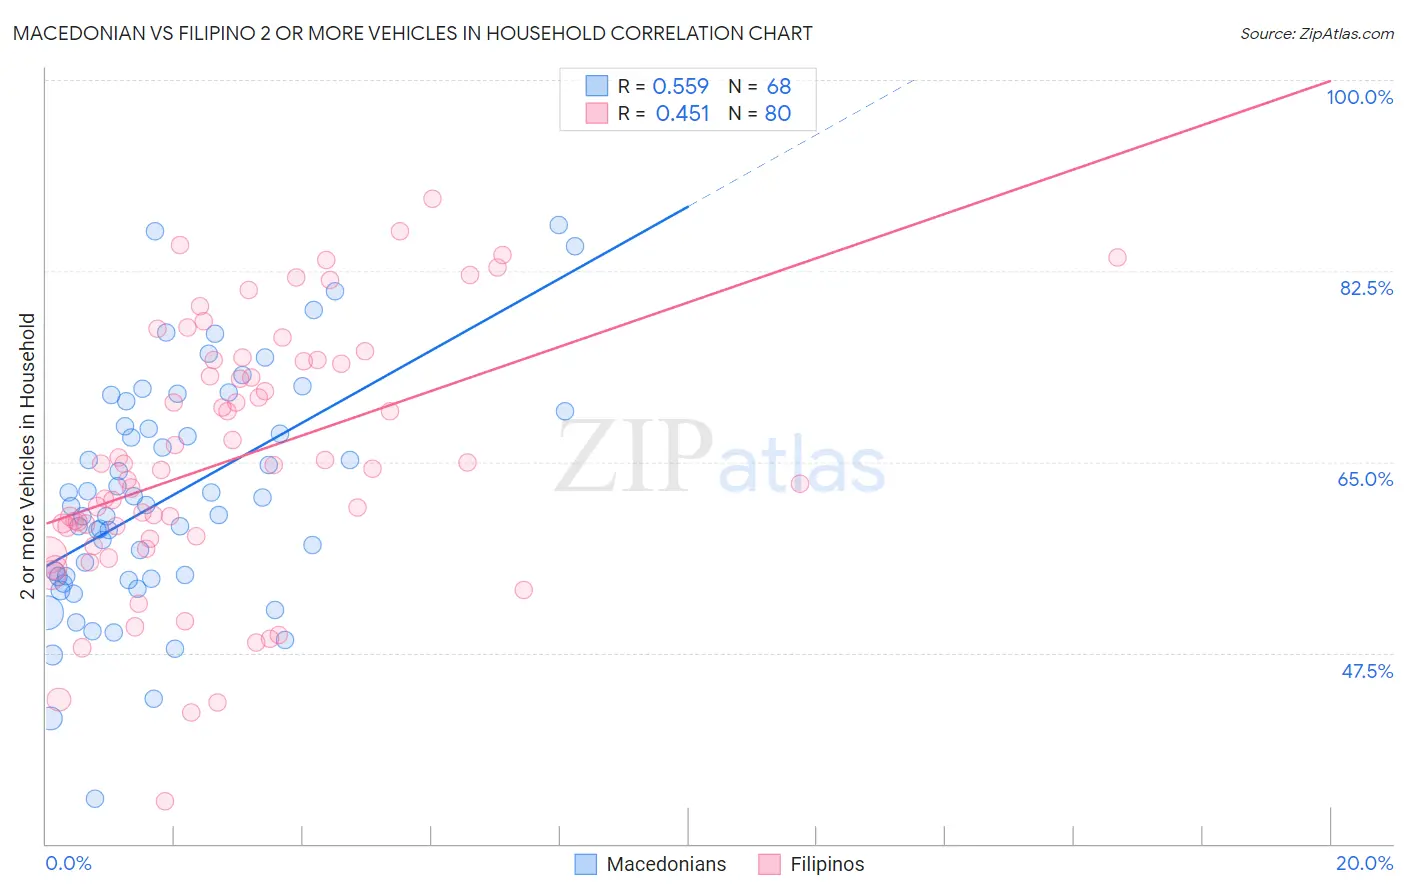
Macedonian vs Filipino 2 or more Vehicles in Household Correlation Chart
The statistical analysis conducted on geographies consisting of 132,543,746 people shows a substantial positive correlation between the proportion of Macedonians and percentage of households with 2 or more vehicles available in the United States with a correlation coefficient (R) of 0.559 and weighted average of 53.3%. Similarly, the statistical analysis conducted on geographies consisting of 254,177,866 people shows a moderate positive correlation between the proportion of Filipinos and percentage of households with 2 or more vehicles available in the United States with a correlation coefficient (R) of 0.451 and weighted average of 57.8%, a difference of 8.5%.
2 or more Vehicles in Household Correlation Summary
| Measurement | Macedonian | Filipino |
| Minimum | 34.1% | 33.9% |
| Maximum | 86.7% | 89.1% |
| Range | 52.6% | 55.2% |
| Mean | 61.9% | 65.2% |
| Median | 61.0% | 64.5% |
| Interquartile 25% (IQ1) | 54.4% | 58.1% |
| Interquartile 75% (IQ3) | 69.0% | 74.3% |
| Interquartile Range (IQR) | 14.5% | 16.2% |
| Standard Deviation (Sample) | 10.7% | 11.8% |
| Standard Deviation (Population) | 10.6% | 11.7% |
Similar Demographics by 2 or more Vehicles in Household
Demographics Similar to Macedonians by 2 or more Vehicles in Household
In terms of 2 or more vehicles in household, the demographic groups most similar to Macedonians are Immigrants from Armenia (53.3%, a difference of 0.070%), Cambodian (53.3%, a difference of 0.070%), Indonesian (53.4%, a difference of 0.11%), Immigrants from Europe (53.2%, a difference of 0.14%), and Immigrants from Sierra Leone (53.2%, a difference of 0.17%).
| Demographics | Rating | Rank | 2 or more Vehicles in Household |
| Immigrants | Nepal | 3.6 /100 | #230 | Tragic 53.5% |
| Panamanians | 3.4 /100 | #231 | Tragic 53.5% |
| Immigrants | Guatemala | 3.2 /100 | #232 | Tragic 53.5% |
| Ugandans | 3.2 /100 | #233 | Tragic 53.5% |
| Immigrants | Switzerland | 3.0 /100 | #234 | Tragic 53.4% |
| Immigrants | Middle Africa | 3.0 /100 | #235 | Tragic 53.4% |
| Indonesians | 2.7 /100 | #236 | Tragic 53.4% |
| Macedonians | 2.4 /100 | #237 | Tragic 53.3% |
| Immigrants | Armenia | 2.3 /100 | #238 | Tragic 53.3% |
| Cambodians | 2.3 /100 | #239 | Tragic 53.3% |
| Immigrants | Europe | 2.1 /100 | #240 | Tragic 53.2% |
| Immigrants | Sierra Leone | 2.1 /100 | #241 | Tragic 53.2% |
| Immigrants | Eastern Asia | 2.1 /100 | #242 | Tragic 53.2% |
| Ethiopians | 1.7 /100 | #243 | Tragic 53.1% |
| Indians (Asian) | 1.7 /100 | #244 | Tragic 53.1% |
Demographics Similar to Filipinos by 2 or more Vehicles in Household
In terms of 2 or more vehicles in household, the demographic groups most similar to Filipinos are Hmong (57.8%, a difference of 0.020%), Shoshone (57.9%, a difference of 0.060%), Ottawa (57.9%, a difference of 0.060%), Burmese (57.8%, a difference of 0.060%), and Slavic (57.8%, a difference of 0.080%).
| Demographics | Rating | Rank | 2 or more Vehicles in Household |
| Thais | 99.1 /100 | #87 | Exceptional 57.9% |
| Immigrants | Iran | 99.1 /100 | #88 | Exceptional 57.9% |
| Immigrants | Germany | 99.0 /100 | #89 | Exceptional 57.9% |
| Hispanics or Latinos | 99.0 /100 | #90 | Exceptional 57.9% |
| Pakistanis | 99.0 /100 | #91 | Exceptional 57.9% |
| Shoshone | 99.0 /100 | #92 | Exceptional 57.9% |
| Ottawa | 99.0 /100 | #93 | Exceptional 57.9% |
| Filipinos | 98.9 /100 | #94 | Exceptional 57.8% |
| Hmong | 98.9 /100 | #95 | Exceptional 57.8% |
| Burmese | 98.8 /100 | #96 | Exceptional 57.8% |
| Slavs | 98.8 /100 | #97 | Exceptional 57.8% |
| Palestinians | 98.6 /100 | #98 | Exceptional 57.7% |
| Cajuns | 98.5 /100 | #99 | Exceptional 57.7% |
| Fijians | 98.4 /100 | #100 | Exceptional 57.6% |
| Lebanese | 98.3 /100 | #101 | Exceptional 57.6% |