Macedonian vs Immigrants from Dominica 2 or more Vehicles in Household
COMPARE
Macedonian
Immigrants from Dominica
2 or more Vehicles in Household
2 or more Vehicles in Household Comparison
Macedonians
Immigrants from Dominica
53.3%
2 OR MORE VEHICLES IN HOUSEHOLD
2.4/ 100
METRIC RATING
237th/ 347
METRIC RANK
41.6%
2 OR MORE VEHICLES IN HOUSEHOLD
0.0/ 100
METRIC RATING
330th/ 347
METRIC RANK
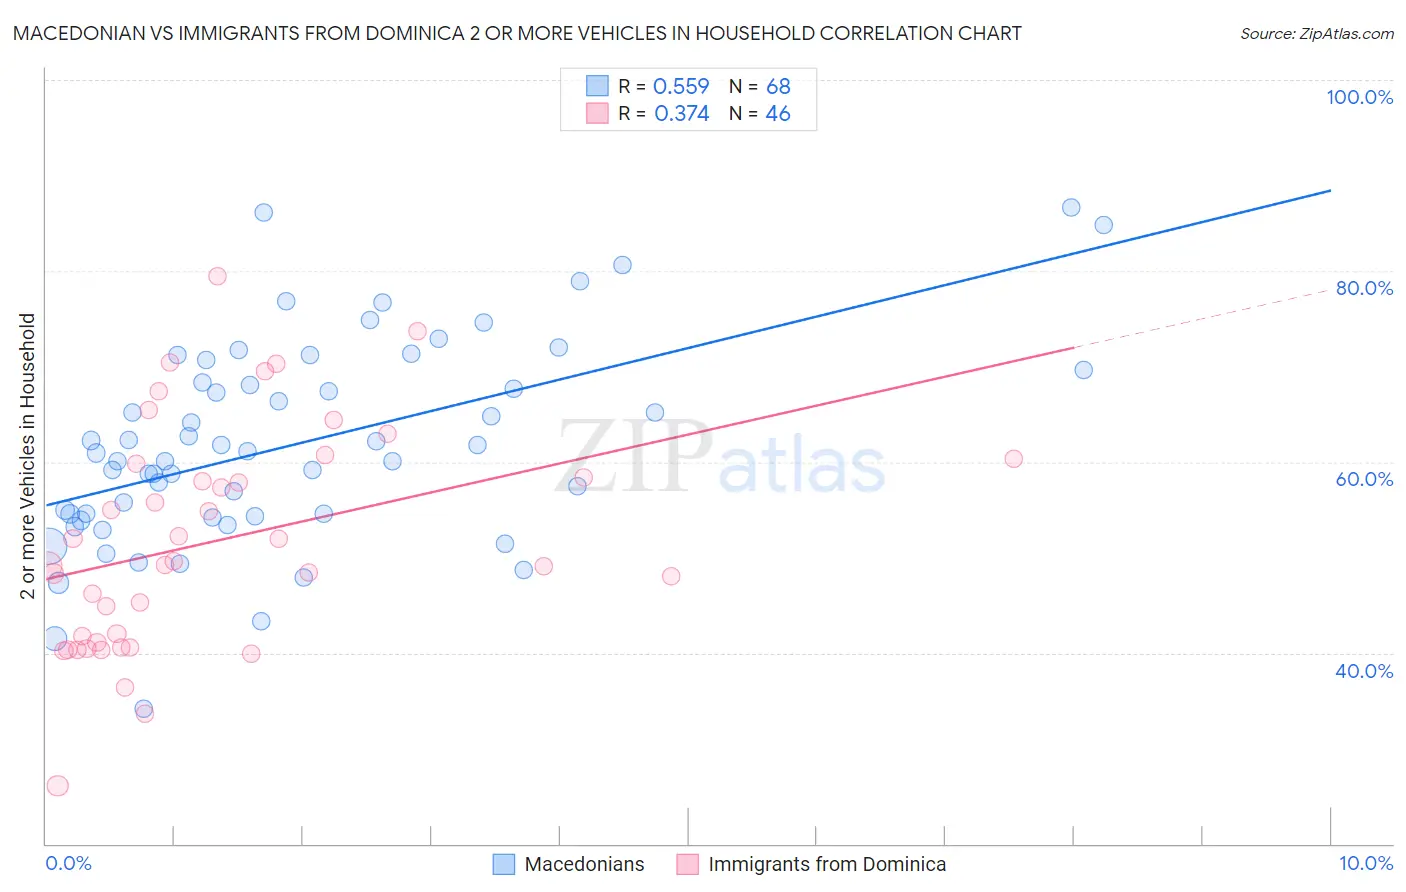
Macedonian vs Immigrants from Dominica 2 or more Vehicles in Household Correlation Chart
The statistical analysis conducted on geographies consisting of 132,543,746 people shows a substantial positive correlation between the proportion of Macedonians and percentage of households with 2 or more vehicles available in the United States with a correlation coefficient (R) of 0.559 and weighted average of 53.3%. Similarly, the statistical analysis conducted on geographies consisting of 83,789,752 people shows a mild positive correlation between the proportion of Immigrants from Dominica and percentage of households with 2 or more vehicles available in the United States with a correlation coefficient (R) of 0.374 and weighted average of 41.6%, a difference of 28.1%.
2 or more Vehicles in Household Correlation Summary
| Measurement | Macedonian | Immigrants from Dominica |
| Minimum | 34.1% | 26.1% |
| Maximum | 86.7% | 79.4% |
| Range | 52.6% | 53.3% |
| Mean | 61.9% | 51.7% |
| Median | 61.0% | 49.4% |
| Interquartile 25% (IQ1) | 54.4% | 41.1% |
| Interquartile 75% (IQ3) | 69.0% | 59.8% |
| Interquartile Range (IQR) | 14.5% | 18.8% |
| Standard Deviation (Sample) | 10.7% | 11.7% |
| Standard Deviation (Population) | 10.6% | 11.5% |
Similar Demographics by 2 or more Vehicles in Household
Demographics Similar to Macedonians by 2 or more Vehicles in Household
In terms of 2 or more vehicles in household, the demographic groups most similar to Macedonians are Immigrants from Armenia (53.3%, a difference of 0.070%), Cambodian (53.3%, a difference of 0.070%), Indonesian (53.4%, a difference of 0.11%), Immigrants from Europe (53.2%, a difference of 0.14%), and Immigrants from Sierra Leone (53.2%, a difference of 0.17%).
| Demographics | Rating | Rank | 2 or more Vehicles in Household |
| Immigrants | Nepal | 3.6 /100 | #230 | Tragic 53.5% |
| Panamanians | 3.4 /100 | #231 | Tragic 53.5% |
| Immigrants | Guatemala | 3.2 /100 | #232 | Tragic 53.5% |
| Ugandans | 3.2 /100 | #233 | Tragic 53.5% |
| Immigrants | Switzerland | 3.0 /100 | #234 | Tragic 53.4% |
| Immigrants | Middle Africa | 3.0 /100 | #235 | Tragic 53.4% |
| Indonesians | 2.7 /100 | #236 | Tragic 53.4% |
| Macedonians | 2.4 /100 | #237 | Tragic 53.3% |
| Immigrants | Armenia | 2.3 /100 | #238 | Tragic 53.3% |
| Cambodians | 2.3 /100 | #239 | Tragic 53.3% |
| Immigrants | Europe | 2.1 /100 | #240 | Tragic 53.2% |
| Immigrants | Sierra Leone | 2.1 /100 | #241 | Tragic 53.2% |
| Immigrants | Eastern Asia | 2.1 /100 | #242 | Tragic 53.2% |
| Ethiopians | 1.7 /100 | #243 | Tragic 53.1% |
| Indians (Asian) | 1.7 /100 | #244 | Tragic 53.1% |
Demographics Similar to Immigrants from Dominica by 2 or more Vehicles in Household
In terms of 2 or more vehicles in household, the demographic groups most similar to Immigrants from Dominica are Ecuadorian (42.0%, a difference of 0.82%), West Indian (41.3%, a difference of 0.85%), Trinidadian and Tobagonian (40.9%, a difference of 1.8%), Inupiat (42.6%, a difference of 2.4%), and Immigrants from Ecuador (40.5%, a difference of 2.8%).
| Demographics | Rating | Rank | 2 or more Vehicles in Household |
| Immigrants | Caribbean | 0.0 /100 | #323 | Tragic 44.2% |
| Immigrants | Cabo Verde | 0.0 /100 | #324 | Tragic 43.3% |
| Immigrants | West Indies | 0.0 /100 | #325 | Tragic 43.1% |
| Immigrants | Senegal | 0.0 /100 | #326 | Tragic 43.0% |
| Immigrants | Yemen | 0.0 /100 | #327 | Tragic 42.8% |
| Inupiat | 0.0 /100 | #328 | Tragic 42.6% |
| Ecuadorians | 0.0 /100 | #329 | Tragic 42.0% |
| Immigrants | Dominica | 0.0 /100 | #330 | Tragic 41.6% |
| West Indians | 0.0 /100 | #331 | Tragic 41.3% |
| Trinidadians and Tobagonians | 0.0 /100 | #332 | Tragic 40.9% |
| Immigrants | Ecuador | 0.0 /100 | #333 | Tragic 40.5% |
| Immigrants | Trinidad and Tobago | 0.0 /100 | #334 | Tragic 40.3% |
| Immigrants | Bangladesh | 0.0 /100 | #335 | Tragic 38.8% |
| Vietnamese | 0.0 /100 | #336 | Tragic 38.5% |
| Barbadians | 0.0 /100 | #337 | Tragic 38.3% |