Macedonian vs Filipino Seniors Poverty Over the Age of 65
COMPARE
Macedonian
Filipino
Seniors Poverty Over the Age of 65
Seniors Poverty Over the Age of 65 Comparison
Macedonians
Filipinos
9.9%
SENIORS POVERTY OVER THE AGE OF 65
98.8/ 100
METRIC RATING
63rd/ 347
METRIC RANK
9.7%
SENIORS POVERTY OVER THE AGE OF 65
99.3/ 100
METRIC RATING
52nd/ 347
METRIC RANK
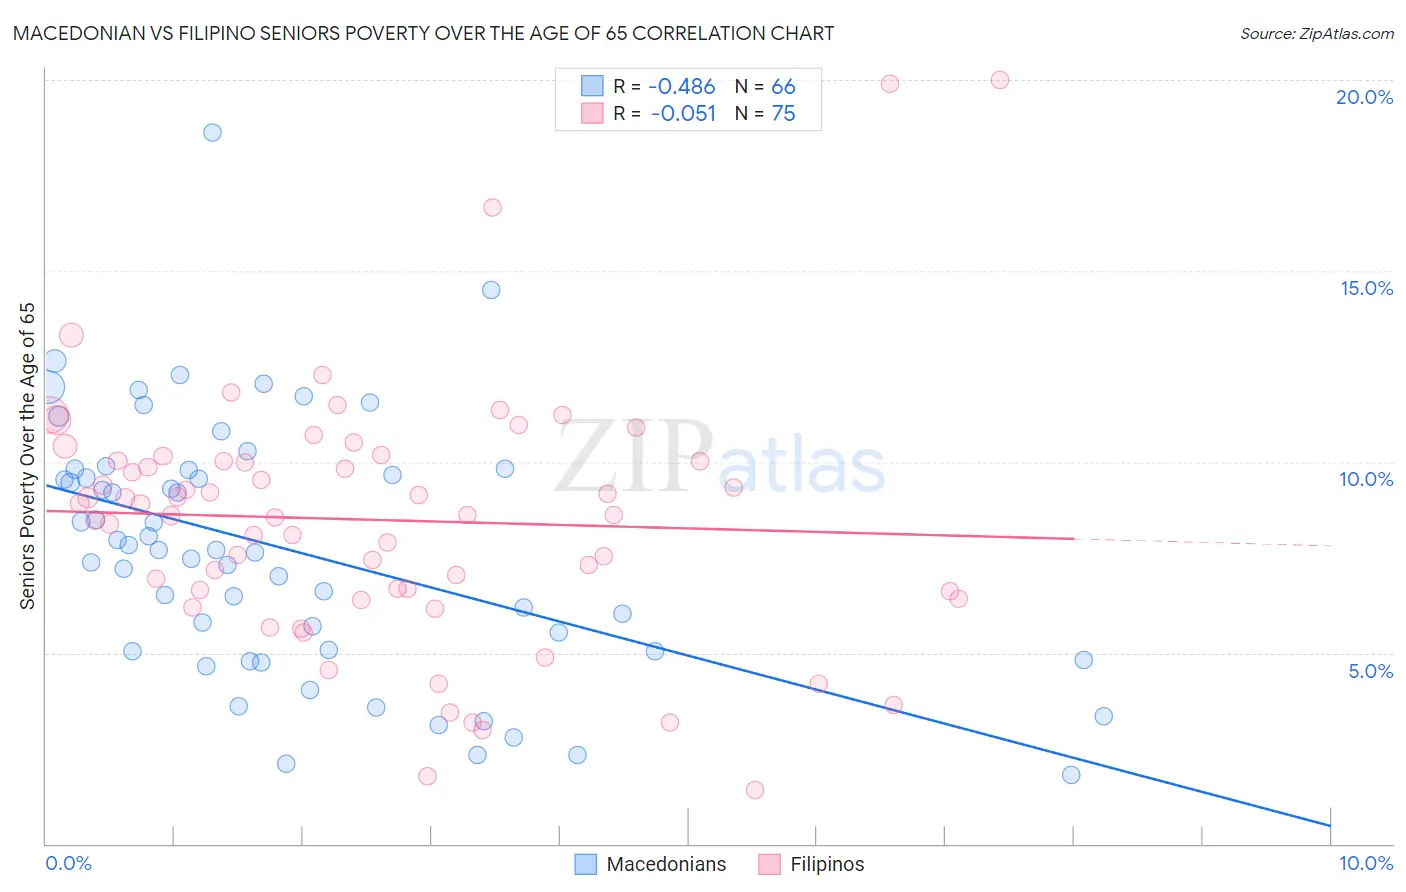
Macedonian vs Filipino Seniors Poverty Over the Age of 65 Correlation Chart
The statistical analysis conducted on geographies consisting of 132,515,092 people shows a moderate negative correlation between the proportion of Macedonians and poverty level among seniors over the age of 65 in the United States with a correlation coefficient (R) of -0.486 and weighted average of 9.9%. Similarly, the statistical analysis conducted on geographies consisting of 253,734,434 people shows a slight negative correlation between the proportion of Filipinos and poverty level among seniors over the age of 65 in the United States with a correlation coefficient (R) of -0.051 and weighted average of 9.7%, a difference of 1.1%.
Seniors Poverty Over the Age of 65 Correlation Summary
| Measurement | Macedonian | Filipino |
| Minimum | 1.8% | 1.4% |
| Maximum | 18.6% | 20.0% |
| Range | 16.8% | 18.6% |
| Mean | 7.7% | 8.5% |
| Median | 7.7% | 8.6% |
| Interquartile 25% (IQ1) | 5.0% | 6.6% |
| Interquartile 75% (IQ3) | 9.8% | 10.0% |
| Interquartile Range (IQR) | 4.7% | 3.4% |
| Standard Deviation (Sample) | 3.3% | 3.4% |
| Standard Deviation (Population) | 3.3% | 3.3% |
Demographics Similar to Macedonians and Filipinos by Seniors Poverty Over the Age of 65
In terms of seniors poverty over the age of 65, the demographic groups most similar to Macedonians are Immigrants from North America (9.9%, a difference of 0.050%), French Canadian (9.8%, a difference of 0.18%), Iranian (9.8%, a difference of 0.22%), Celtic (9.8%, a difference of 0.31%), and Pennsylvania German (9.9%, a difference of 0.33%). Similarly, the demographic groups most similar to Filipinos are Carpatho Rusyn (9.7%, a difference of 0.020%), Slavic (9.8%, a difference of 0.11%), Immigrants from Northern Europe (9.8%, a difference of 0.16%), Afghan (9.8%, a difference of 0.29%), and Immigrants from England (9.8%, a difference of 0.41%).
| Demographics | Rating | Rank | Seniors Poverty Over the Age of 65 |
| Immigrants | South Central Asia | 99.5 /100 | #47 | Exceptional 9.7% |
| French | 99.5 /100 | #48 | Exceptional 9.7% |
| Immigrants | Lithuania | 99.4 /100 | #49 | Exceptional 9.7% |
| Hungarians | 99.4 /100 | #50 | Exceptional 9.7% |
| Carpatho Rusyns | 99.3 /100 | #51 | Exceptional 9.7% |
| Filipinos | 99.3 /100 | #52 | Exceptional 9.7% |
| Slavs | 99.2 /100 | #53 | Exceptional 9.8% |
| Immigrants | Northern Europe | 99.2 /100 | #54 | Exceptional 9.8% |
| Afghans | 99.2 /100 | #55 | Exceptional 9.8% |
| Immigrants | England | 99.1 /100 | #56 | Exceptional 9.8% |
| Bolivians | 99.1 /100 | #57 | Exceptional 9.8% |
| Serbians | 99.1 /100 | #58 | Exceptional 9.8% |
| Immigrants | Canada | 99.0 /100 | #59 | Exceptional 9.8% |
| Celtics | 99.0 /100 | #60 | Exceptional 9.8% |
| Iranians | 98.9 /100 | #61 | Exceptional 9.8% |
| French Canadians | 98.9 /100 | #62 | Exceptional 9.8% |
| Macedonians | 98.8 /100 | #63 | Exceptional 9.9% |
| Immigrants | North America | 98.8 /100 | #64 | Exceptional 9.9% |
| Pennsylvania Germans | 98.7 /100 | #65 | Exceptional 9.9% |
| Immigrants | Netherlands | 98.7 /100 | #66 | Exceptional 9.9% |
| Immigrants | Austria | 98.6 /100 | #67 | Exceptional 9.9% |