Macedonian vs Filipino 8th Grade
COMPARE
Macedonian
Filipino
8th Grade
8th Grade Comparison
Macedonians
Filipinos
96.7%
8TH GRADE
99.8/ 100
METRIC RATING
57th/ 347
METRIC RANK
96.2%
8TH GRADE
94.6/ 100
METRIC RATING
123rd/ 347
METRIC RANK
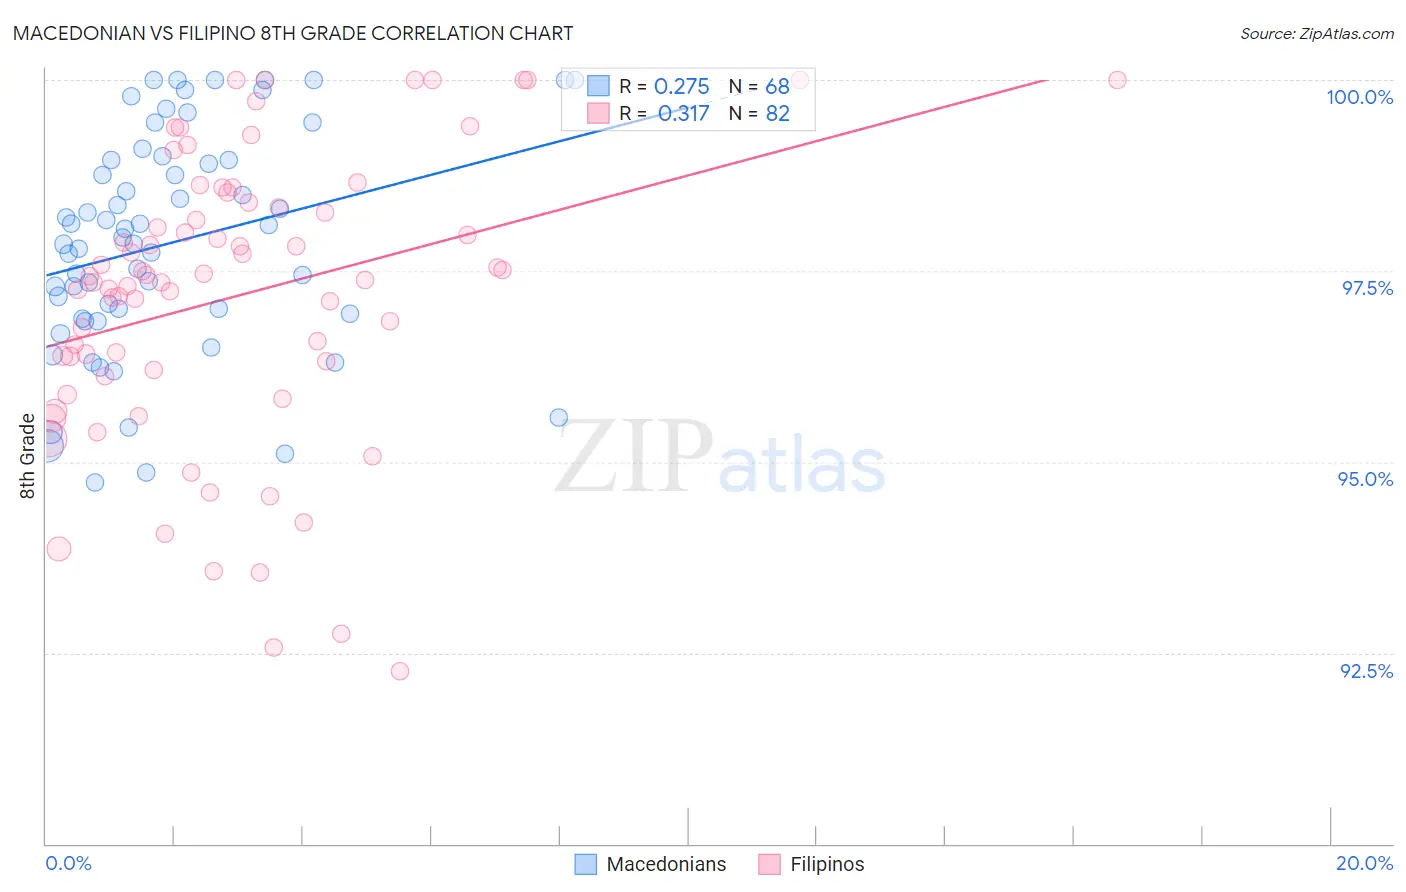
Macedonian vs Filipino 8th Grade Correlation Chart
The statistical analysis conducted on geographies consisting of 132,592,860 people shows a weak positive correlation between the proportion of Macedonians and percentage of population with at least 8th grade education in the United States with a correlation coefficient (R) of 0.275 and weighted average of 96.7%. Similarly, the statistical analysis conducted on geographies consisting of 254,352,171 people shows a mild positive correlation between the proportion of Filipinos and percentage of population with at least 8th grade education in the United States with a correlation coefficient (R) of 0.317 and weighted average of 96.2%, a difference of 0.58%.
8th Grade Correlation Summary
| Measurement | Macedonian | Filipino |
| Minimum | 94.7% | 92.3% |
| Maximum | 100.0% | 100.0% |
| Range | 5.3% | 7.7% |
| Mean | 97.9% | 97.2% |
| Median | 97.9% | 97.4% |
| Interquartile 25% (IQ1) | 96.9% | 96.2% |
| Interquartile 75% (IQ3) | 99.0% | 98.4% |
| Interquartile Range (IQR) | 2.0% | 2.2% |
| Standard Deviation (Sample) | 1.4% | 1.9% |
| Standard Deviation (Population) | 1.4% | 1.9% |
Similar Demographics by 8th Grade
Demographics Similar to Macedonians by 8th Grade
In terms of 8th grade, the demographic groups most similar to Macedonians are Australian (96.7%, a difference of 0.0%), Austrian (96.7%, a difference of 0.010%), Serbian (96.7%, a difference of 0.010%), Russian (96.7%, a difference of 0.010%), and Greek (96.8%, a difference of 0.030%).
| Demographics | Rating | Rank | 8th Grade |
| Immigrants | Scotland | 99.9 /100 | #50 | Exceptional 96.8% |
| Celtics | 99.9 /100 | #51 | Exceptional 96.8% |
| Greeks | 99.9 /100 | #52 | Exceptional 96.8% |
| Austrians | 99.9 /100 | #53 | Exceptional 96.7% |
| Serbians | 99.8 /100 | #54 | Exceptional 96.7% |
| Russians | 99.8 /100 | #55 | Exceptional 96.7% |
| Australians | 99.8 /100 | #56 | Exceptional 96.7% |
| Macedonians | 99.8 /100 | #57 | Exceptional 96.7% |
| Immigrants | Canada | 99.8 /100 | #58 | Exceptional 96.7% |
| Immigrants | North America | 99.8 /100 | #59 | Exceptional 96.7% |
| Immigrants | Northern Europe | 99.8 /100 | #60 | Exceptional 96.7% |
| Immigrants | Austria | 99.8 /100 | #61 | Exceptional 96.7% |
| Whites/Caucasians | 99.8 /100 | #62 | Exceptional 96.7% |
| Ukrainians | 99.7 /100 | #63 | Exceptional 96.7% |
| Immigrants | India | 99.7 /100 | #64 | Exceptional 96.6% |
Demographics Similar to Filipinos by 8th Grade
In terms of 8th grade, the demographic groups most similar to Filipinos are Palestinian (96.2%, a difference of 0.0%), Immigrants from Switzerland (96.2%, a difference of 0.020%), Immigrants from France (96.2%, a difference of 0.020%), Immigrants from Bulgaria (96.2%, a difference of 0.020%), and Immigrants from Europe (96.2%, a difference of 0.020%).
| Demographics | Rating | Rank | 8th Grade |
| Immigrants | Nonimmigrants | 96.0 /100 | #116 | Exceptional 96.2% |
| Immigrants | Croatia | 96.0 /100 | #117 | Exceptional 96.2% |
| Immigrants | Norway | 95.7 /100 | #118 | Exceptional 96.2% |
| Immigrants | Switzerland | 95.3 /100 | #119 | Exceptional 96.2% |
| Immigrants | France | 95.3 /100 | #120 | Exceptional 96.2% |
| Immigrants | Bulgaria | 95.3 /100 | #121 | Exceptional 96.2% |
| Immigrants | Europe | 95.3 /100 | #122 | Exceptional 96.2% |
| Filipinos | 94.6 /100 | #123 | Exceptional 96.2% |
| Palestinians | 94.6 /100 | #124 | Exceptional 96.2% |
| Immigrants | Romania | 94.1 /100 | #125 | Exceptional 96.2% |
| Choctaw | 94.0 /100 | #126 | Exceptional 96.2% |
| Immigrants | Serbia | 94.0 /100 | #127 | Exceptional 96.2% |
| Immigrants | Bosnia and Herzegovina | 93.9 /100 | #128 | Exceptional 96.2% |
| Cheyenne | 93.3 /100 | #129 | Exceptional 96.1% |
| Soviet Union | 92.6 /100 | #130 | Exceptional 96.1% |