Lumbee vs Immigrants from Jamaica Family Households with Children
COMPARE
Lumbee
Immigrants from Jamaica
Family Households with Children
Family Households with Children Comparison
Lumbee
Immigrants from Jamaica
26.3%
FAMILY HOUSEHOLDS WITH CHILDREN
0.0/ 100
METRIC RATING
308th/ 347
METRIC RANK
26.8%
FAMILY HOUSEHOLDS WITH CHILDREN
1.2/ 100
METRIC RATING
260th/ 347
METRIC RANK
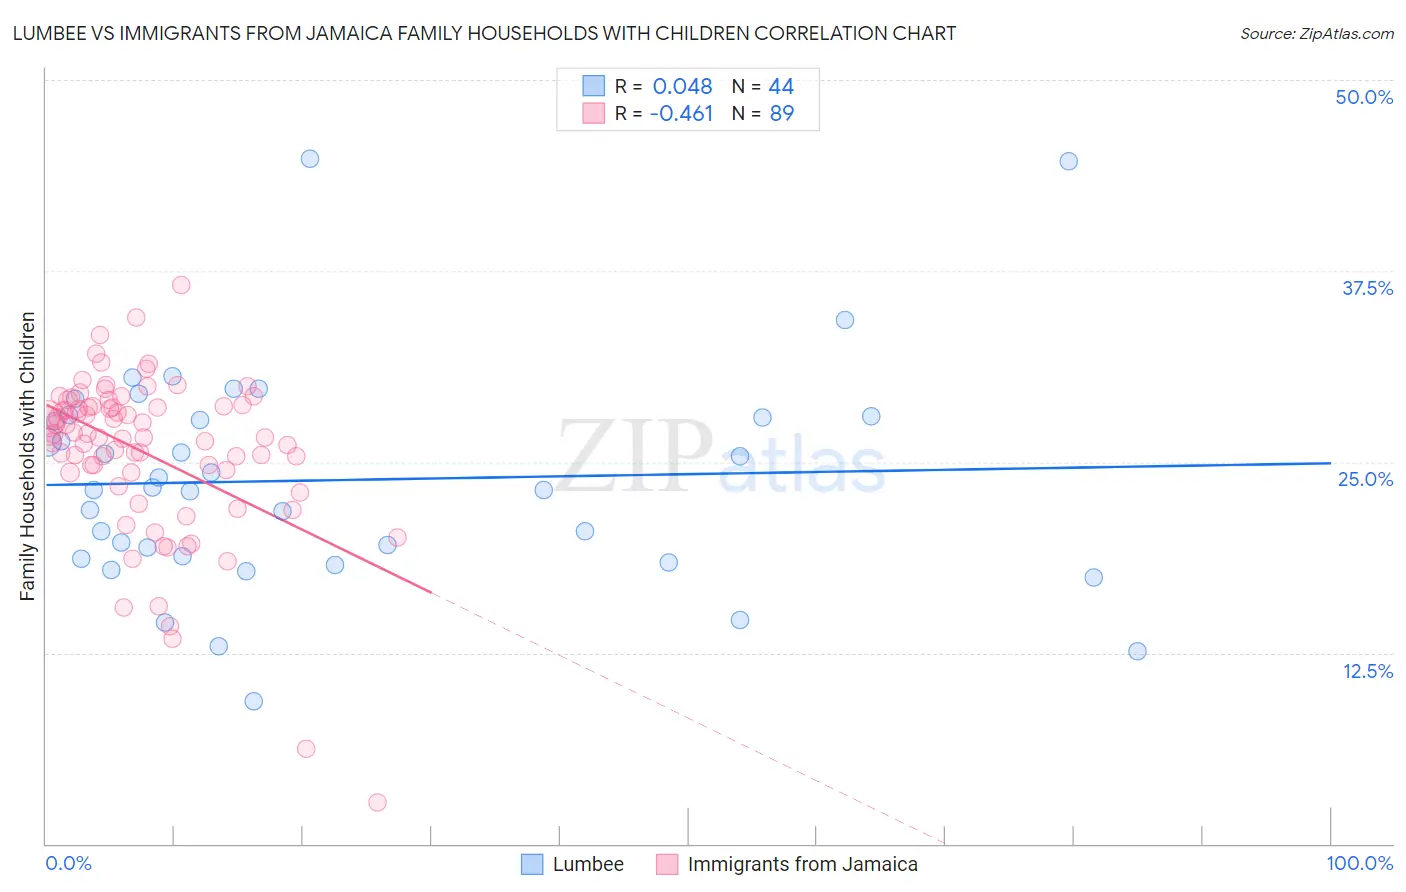
Lumbee vs Immigrants from Jamaica Family Households with Children Correlation Chart
The statistical analysis conducted on geographies consisting of 92,262,389 people shows no correlation between the proportion of Lumbee and percentage of family households with children in the United States with a correlation coefficient (R) of 0.048 and weighted average of 26.3%. Similarly, the statistical analysis conducted on geographies consisting of 301,520,454 people shows a moderate negative correlation between the proportion of Immigrants from Jamaica and percentage of family households with children in the United States with a correlation coefficient (R) of -0.461 and weighted average of 26.8%, a difference of 1.9%.
Family Households with Children Correlation Summary
| Measurement | Lumbee | Immigrants from Jamaica |
| Minimum | 9.3% | 2.7% |
| Maximum | 44.9% | 36.6% |
| Range | 35.5% | 33.9% |
| Mean | 23.8% | 25.6% |
| Median | 23.2% | 26.7% |
| Interquartile 25% (IQ1) | 18.7% | 24.3% |
| Interquartile 75% (IQ3) | 27.9% | 28.6% |
| Interquartile Range (IQR) | 9.2% | 4.3% |
| Standard Deviation (Sample) | 7.2% | 5.4% |
| Standard Deviation (Population) | 7.1% | 5.4% |
Similar Demographics by Family Households with Children
Demographics Similar to Lumbee by Family Households with Children
In terms of family households with children, the demographic groups most similar to Lumbee are West Indian (26.3%, a difference of 0.020%), Bermudan (26.3%, a difference of 0.10%), Immigrants from Somalia (26.3%, a difference of 0.11%), Guyanese (26.3%, a difference of 0.12%), and Immigrants from Bahamas (26.3%, a difference of 0.14%).
| Demographics | Rating | Rank | Family Households with Children |
| Immigrants | Trinidad and Tobago | 0.1 /100 | #301 | Tragic 26.4% |
| Serbians | 0.1 /100 | #302 | Tragic 26.4% |
| Immigrants | Guyana | 0.1 /100 | #303 | Tragic 26.3% |
| Immigrants | Bahamas | 0.1 /100 | #304 | Tragic 26.3% |
| Guyanese | 0.1 /100 | #305 | Tragic 26.3% |
| Bermudans | 0.1 /100 | #306 | Tragic 26.3% |
| West Indians | 0.0 /100 | #307 | Tragic 26.3% |
| Lumbee | 0.0 /100 | #308 | Tragic 26.3% |
| Immigrants | Somalia | 0.0 /100 | #309 | Tragic 26.3% |
| Marshallese | 0.0 /100 | #310 | Tragic 26.2% |
| Colville | 0.0 /100 | #311 | Tragic 26.2% |
| Immigrants | Czechoslovakia | 0.0 /100 | #312 | Tragic 26.2% |
| Cree | 0.0 /100 | #313 | Tragic 26.2% |
| French Canadians | 0.0 /100 | #314 | Tragic 26.1% |
| Immigrants | Norway | 0.0 /100 | #315 | Tragic 26.1% |
Demographics Similar to Immigrants from Jamaica by Family Households with Children
In terms of family households with children, the demographic groups most similar to Immigrants from Jamaica are Immigrants from Lithuania (26.8%, a difference of 0.020%), Slavic (26.8%, a difference of 0.050%), Immigrants from Cuba (26.8%, a difference of 0.050%), Immigrants from Belarus (26.8%, a difference of 0.060%), and Scotch-Irish (26.8%, a difference of 0.10%).
| Demographics | Rating | Rank | Family Households with Children |
| Italians | 1.5 /100 | #253 | Tragic 26.8% |
| Immigrants | Scotland | 1.5 /100 | #254 | Tragic 26.8% |
| German Russians | 1.5 /100 | #255 | Tragic 26.8% |
| Scotch-Irish | 1.4 /100 | #256 | Tragic 26.8% |
| Slavs | 1.3 /100 | #257 | Tragic 26.8% |
| Immigrants | Cuba | 1.3 /100 | #258 | Tragic 26.8% |
| Immigrants | Lithuania | 1.2 /100 | #259 | Tragic 26.8% |
| Immigrants | Jamaica | 1.2 /100 | #260 | Tragic 26.8% |
| Immigrants | Belarus | 1.1 /100 | #261 | Tragic 26.8% |
| Immigrants | Russia | 1.0 /100 | #262 | Tragic 26.8% |
| Immigrants | North Macedonia | 1.0 /100 | #263 | Tragic 26.7% |
| Taiwanese | 0.9 /100 | #264 | Tragic 26.7% |
| Chippewa | 0.9 /100 | #265 | Tragic 26.7% |
| Maltese | 0.9 /100 | #266 | Tragic 26.7% |
| Immigrants | Uzbekistan | 0.9 /100 | #267 | Tragic 26.7% |