Liberian vs Turkish No Vehicles in Household
COMPARE
Liberian
Turkish
No Vehicles in Household
No Vehicles in Household Comparison
Liberians
Turks
12.0%
NO VEHICLES IN HOUSEHOLD
1.2/ 100
METRIC RATING
256th/ 347
METRIC RANK
11.7%
NO VEHICLES IN HOUSEHOLD
2.6/ 100
METRIC RATING
242nd/ 347
METRIC RANK
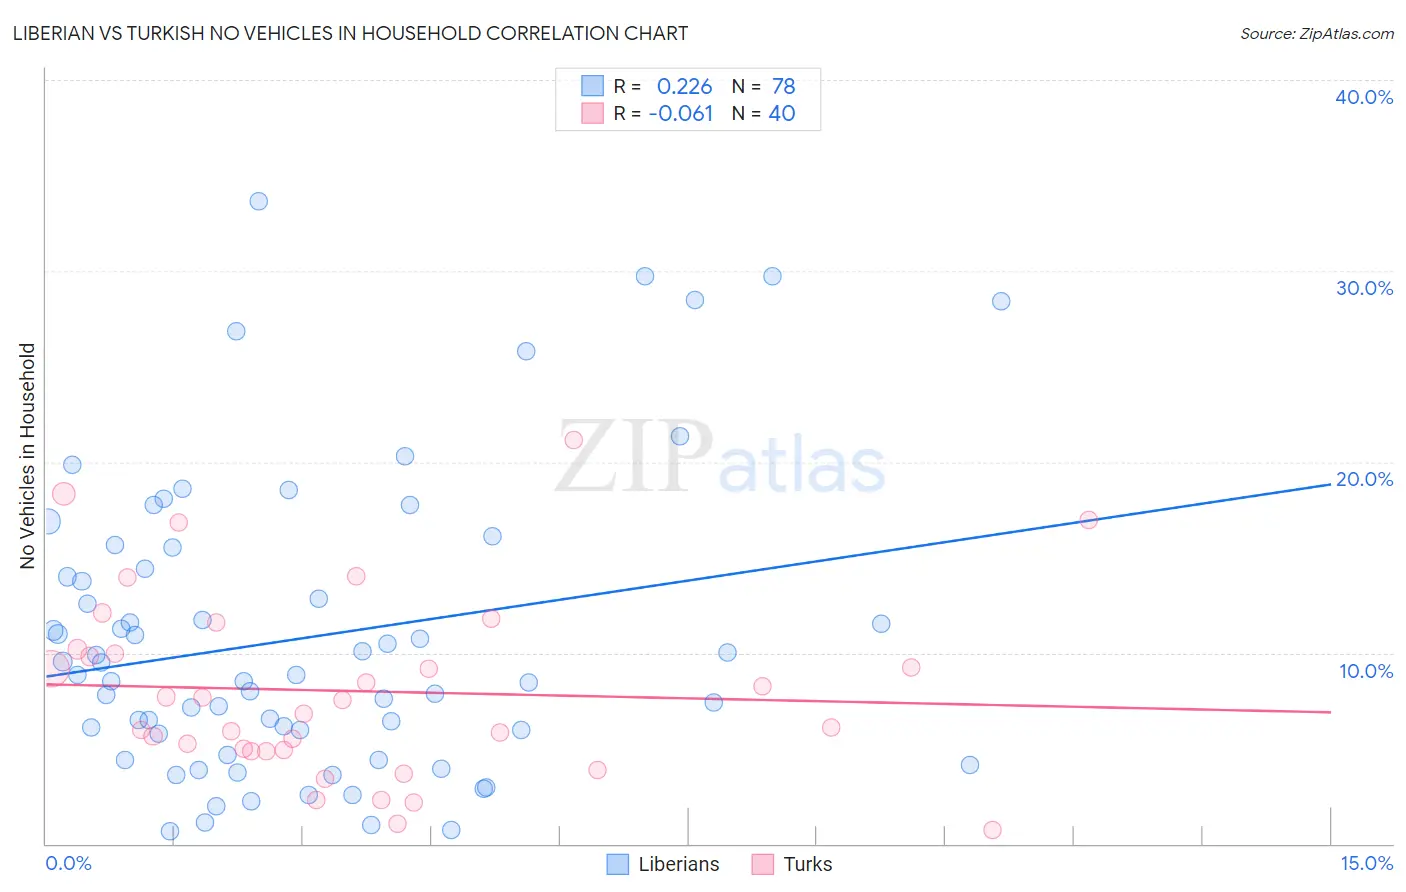
Liberian vs Turkish No Vehicles in Household Correlation Chart
The statistical analysis conducted on geographies consisting of 118,010,925 people shows a weak positive correlation between the proportion of Liberians and percentage of households with no vehicle available in the United States with a correlation coefficient (R) of 0.226 and weighted average of 12.0%. Similarly, the statistical analysis conducted on geographies consisting of 271,510,878 people shows a slight negative correlation between the proportion of Turks and percentage of households with no vehicle available in the United States with a correlation coefficient (R) of -0.061 and weighted average of 11.7%, a difference of 2.5%.
No Vehicles in Household Correlation Summary
| Measurement | Liberian | Turkish |
| Minimum | 0.64% | 0.69% |
| Maximum | 33.6% | 21.1% |
| Range | 33.0% | 20.4% |
| Mean | 10.8% | 8.0% |
| Median | 8.8% | 7.1% |
| Interquartile 25% (IQ1) | 5.7% | 4.9% |
| Interquartile 75% (IQ3) | 14.4% | 10.1% |
| Interquartile Range (IQR) | 8.7% | 5.2% |
| Standard Deviation (Sample) | 7.7% | 4.8% |
| Standard Deviation (Population) | 7.6% | 4.8% |
Demographics Similar to Liberians and Turks by No Vehicles in Household
In terms of no vehicles in household, the demographic groups most similar to Liberians are Honduran (12.0%, a difference of 0.050%), Immigrants from Uruguay (11.9%, a difference of 0.32%), Egyptian (11.9%, a difference of 0.64%), Immigrants from Serbia (11.9%, a difference of 0.71%), and Nigerian (12.1%, a difference of 0.74%). Similarly, the demographic groups most similar to Turks are Eastern European (11.7%, a difference of 0.11%), Immigrants (11.7%, a difference of 0.12%), Taiwanese (11.7%, a difference of 0.18%), Cheyenne (11.7%, a difference of 0.33%), and Immigrants from Portugal (11.7%, a difference of 0.51%).
| Demographics | Rating | Rank | No Vehicles in Household |
| Taiwanese | 2.8 /100 | #239 | Tragic 11.7% |
| Immigrants | Immigrants | 2.7 /100 | #240 | Tragic 11.7% |
| Eastern Europeans | 2.7 /100 | #241 | Tragic 11.7% |
| Turks | 2.6 /100 | #242 | Tragic 11.7% |
| Cheyenne | 2.4 /100 | #243 | Tragic 11.7% |
| Immigrants | Portugal | 2.2 /100 | #244 | Tragic 11.7% |
| Immigrants | Honduras | 2.1 /100 | #245 | Tragic 11.8% |
| Menominee | 2.0 /100 | #246 | Tragic 11.8% |
| Immigrants | Czechoslovakia | 2.0 /100 | #247 | Tragic 11.8% |
| Immigrants | Belgium | 1.9 /100 | #248 | Tragic 11.8% |
| Immigrants | Nigeria | 1.9 /100 | #249 | Tragic 11.8% |
| Paiute | 1.8 /100 | #250 | Tragic 11.8% |
| Blacks/African Americans | 1.6 /100 | #251 | Tragic 11.9% |
| Immigrants | Serbia | 1.5 /100 | #252 | Tragic 11.9% |
| Egyptians | 1.4 /100 | #253 | Tragic 11.9% |
| Immigrants | Uruguay | 1.3 /100 | #254 | Tragic 11.9% |
| Hondurans | 1.2 /100 | #255 | Tragic 12.0% |
| Liberians | 1.2 /100 | #256 | Tragic 12.0% |
| Nigerians | 0.9 /100 | #257 | Tragic 12.1% |
| South American Indians | 0.9 /100 | #258 | Tragic 12.1% |
| Immigrants | Latvia | 0.8 /100 | #259 | Tragic 12.1% |