Lebanese vs Zimbabwean Unemployment Among Women with Children Ages 6 to 17 years
COMPARE
Lebanese
Zimbabwean
Unemployment Among Women with Children Ages 6 to 17 years
Unemployment Among Women with Children Ages 6 to 17 years Comparison
Lebanese
Zimbabweans
9.5%
UNEMPLOYMENT AMONG WOMEN WITH CHILDREN AGES 6 TO 17 YEARS
0.5/ 100
METRIC RATING
263rd/ 347
METRIC RANK
8.6%
UNEMPLOYMENT AMONG WOMEN WITH CHILDREN AGES 6 TO 17 YEARS
96.3/ 100
METRIC RATING
116th/ 347
METRIC RANK
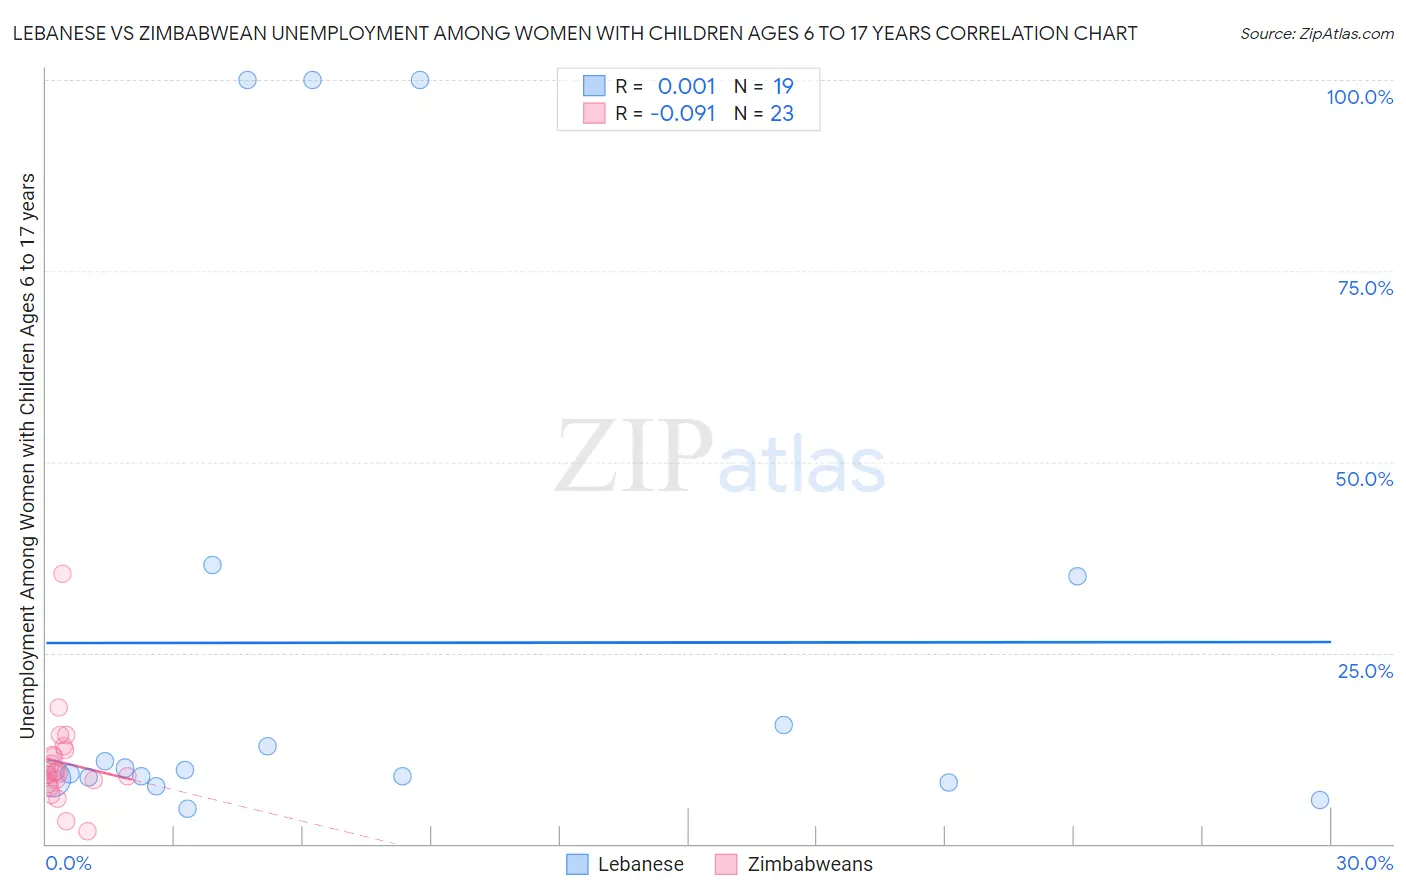
Lebanese vs Zimbabwean Unemployment Among Women with Children Ages 6 to 17 years Correlation Chart
The statistical analysis conducted on geographies consisting of 283,181,841 people shows no correlation between the proportion of Lebanese and unemployment rate among women with children between the ages 6 and 17 in the United States with a correlation coefficient (R) of 0.001 and weighted average of 9.5%. Similarly, the statistical analysis conducted on geographies consisting of 62,721,931 people shows a slight negative correlation between the proportion of Zimbabweans and unemployment rate among women with children between the ages 6 and 17 in the United States with a correlation coefficient (R) of -0.091 and weighted average of 8.6%, a difference of 9.9%.
Unemployment Among Women with Children Ages 6 to 17 years Correlation Summary
| Measurement | Lebanese | Zimbabwean |
| Minimum | 4.6% | 1.7% |
| Maximum | 100.0% | 35.3% |
| Range | 95.4% | 33.6% |
| Mean | 26.3% | 10.6% |
| Median | 9.6% | 9.2% |
| Interquartile 25% (IQ1) | 8.5% | 7.9% |
| Interquartile 75% (IQ3) | 35.1% | 12.3% |
| Interquartile Range (IQR) | 26.6% | 4.4% |
| Standard Deviation (Sample) | 33.9% | 6.5% |
| Standard Deviation (Population) | 33.0% | 6.3% |
Similar Demographics by Unemployment Among Women with Children Ages 6 to 17 years
Demographics Similar to Lebanese by Unemployment Among Women with Children Ages 6 to 17 years
In terms of unemployment among women with children ages 6 to 17 years, the demographic groups most similar to Lebanese are Senegalese (9.5%, a difference of 0.040%), South American (9.5%, a difference of 0.090%), Italian (9.5%, a difference of 0.18%), Immigrants from Ghana (9.5%, a difference of 0.24%), and West Indian (9.5%, a difference of 0.27%).
| Demographics | Rating | Rank | Unemployment Among Women with Children Ages 6 to 17 years |
| Canadians | 0.8 /100 | #256 | Tragic 9.4% |
| Celtics | 0.7 /100 | #257 | Tragic 9.5% |
| Immigrants | Mexico | 0.7 /100 | #258 | Tragic 9.5% |
| Immigrants | Central America | 0.6 /100 | #259 | Tragic 9.5% |
| Italians | 0.6 /100 | #260 | Tragic 9.5% |
| South Americans | 0.5 /100 | #261 | Tragic 9.5% |
| Senegalese | 0.5 /100 | #262 | Tragic 9.5% |
| Lebanese | 0.5 /100 | #263 | Tragic 9.5% |
| Immigrants | Ghana | 0.4 /100 | #264 | Tragic 9.5% |
| West Indians | 0.4 /100 | #265 | Tragic 9.5% |
| Immigrants | Jamaica | 0.3 /100 | #266 | Tragic 9.5% |
| Irish | 0.3 /100 | #267 | Tragic 9.5% |
| Ghanaians | 0.2 /100 | #268 | Tragic 9.6% |
| Blackfeet | 0.2 /100 | #269 | Tragic 9.6% |
| Immigrants | Nicaragua | 0.2 /100 | #270 | Tragic 9.6% |
Demographics Similar to Zimbabweans by Unemployment Among Women with Children Ages 6 to 17 years
In terms of unemployment among women with children ages 6 to 17 years, the demographic groups most similar to Zimbabweans are Albanian (8.6%, a difference of 0.010%), Pueblo (8.6%, a difference of 0.040%), Immigrants from Grenada (8.6%, a difference of 0.050%), Argentinean (8.6%, a difference of 0.070%), and Israeli (8.7%, a difference of 0.13%).
| Demographics | Rating | Rank | Unemployment Among Women with Children Ages 6 to 17 years |
| Immigrants | Romania | 97.5 /100 | #109 | Exceptional 8.6% |
| Latvians | 97.4 /100 | #110 | Exceptional 8.6% |
| Immigrants | Ukraine | 97.4 /100 | #111 | Exceptional 8.6% |
| Romanians | 97.1 /100 | #112 | Exceptional 8.6% |
| Eastern Europeans | 96.8 /100 | #113 | Exceptional 8.6% |
| Immigrants | Russia | 96.7 /100 | #114 | Exceptional 8.6% |
| Argentineans | 96.5 /100 | #115 | Exceptional 8.6% |
| Zimbabweans | 96.3 /100 | #116 | Exceptional 8.6% |
| Albanians | 96.3 /100 | #117 | Exceptional 8.6% |
| Pueblo | 96.2 /100 | #118 | Exceptional 8.6% |
| Immigrants | Grenada | 96.2 /100 | #119 | Exceptional 8.6% |
| Israelis | 95.9 /100 | #120 | Exceptional 8.7% |
| Immigrants | Denmark | 95.5 /100 | #121 | Exceptional 8.7% |
| Immigrants | Egypt | 95.0 /100 | #122 | Exceptional 8.7% |
| Immigrants | Morocco | 94.9 /100 | #123 | Exceptional 8.7% |