Lebanese vs Scotch-Irish 2 or more Vehicles in Household
COMPARE
Lebanese
Scotch-Irish
2 or more Vehicles in Household
2 or more Vehicles in Household Comparison
Lebanese
Scotch-Irish
57.6%
2 OR MORE VEHICLES IN HOUSEHOLD
98.3/ 100
METRIC RATING
101st/ 347
METRIC RANK
60.9%
2 OR MORE VEHICLES IN HOUSEHOLD
100.0/ 100
METRIC RATING
23rd/ 347
METRIC RANK
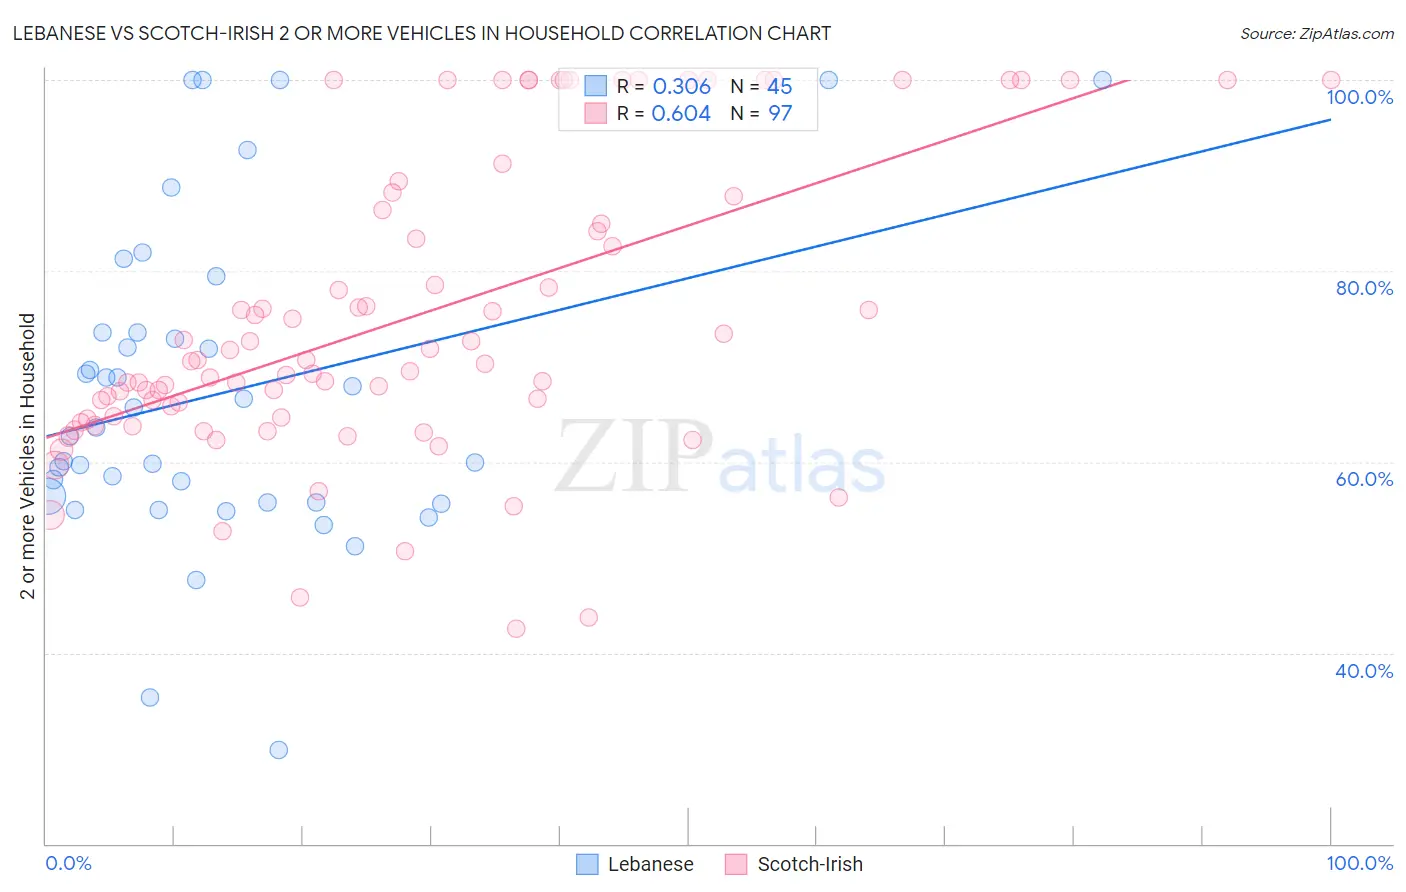
Lebanese vs Scotch-Irish 2 or more Vehicles in Household Correlation Chart
The statistical analysis conducted on geographies consisting of 401,369,606 people shows a mild positive correlation between the proportion of Lebanese and percentage of households with 2 or more vehicles available in the United States with a correlation coefficient (R) of 0.306 and weighted average of 57.6%. Similarly, the statistical analysis conducted on geographies consisting of 548,429,166 people shows a significant positive correlation between the proportion of Scotch-Irish and percentage of households with 2 or more vehicles available in the United States with a correlation coefficient (R) of 0.604 and weighted average of 60.9%, a difference of 5.8%.
2 or more Vehicles in Household Correlation Summary
| Measurement | Lebanese | Scotch-Irish |
| Minimum | 29.8% | 42.5% |
| Maximum | 100.0% | 100.0% |
| Range | 70.2% | 57.5% |
| Mean | 67.2% | 75.1% |
| Median | 63.5% | 70.6% |
| Interquartile 25% (IQ1) | 55.8% | 64.5% |
| Interquartile 75% (IQ3) | 73.5% | 87.2% |
| Interquartile Range (IQR) | 17.8% | 22.6% |
| Standard Deviation (Sample) | 16.6% | 15.5% |
| Standard Deviation (Population) | 16.4% | 15.4% |
Similar Demographics by 2 or more Vehicles in Household
Demographics Similar to Lebanese by 2 or more Vehicles in Household
In terms of 2 or more vehicles in household, the demographic groups most similar to Lebanese are Fijian (57.6%, a difference of 0.050%), Immigrants from Bolivia (57.6%, a difference of 0.050%), Jordanian (57.6%, a difference of 0.050%), Immigrants from Indonesia (57.6%, a difference of 0.050%), and Immigrants from Korea (57.6%, a difference of 0.050%).
| Demographics | Rating | Rank | 2 or more Vehicles in Household |
| Filipinos | 98.9 /100 | #94 | Exceptional 57.8% |
| Hmong | 98.9 /100 | #95 | Exceptional 57.8% |
| Burmese | 98.8 /100 | #96 | Exceptional 57.8% |
| Slavs | 98.8 /100 | #97 | Exceptional 57.8% |
| Palestinians | 98.6 /100 | #98 | Exceptional 57.7% |
| Cajuns | 98.5 /100 | #99 | Exceptional 57.7% |
| Fijians | 98.4 /100 | #100 | Exceptional 57.6% |
| Lebanese | 98.3 /100 | #101 | Exceptional 57.6% |
| Immigrants | Bolivia | 98.2 /100 | #102 | Exceptional 57.6% |
| Jordanians | 98.2 /100 | #103 | Exceptional 57.6% |
| Immigrants | Indonesia | 98.2 /100 | #104 | Exceptional 57.6% |
| Immigrants | Korea | 98.2 /100 | #105 | Exceptional 57.6% |
| Immigrants | Oceania | 98.2 /100 | #106 | Exceptional 57.5% |
| Immigrants | Netherlands | 98.2 /100 | #107 | Exceptional 57.5% |
| Immigrants | Canada | 98.1 /100 | #108 | Exceptional 57.5% |
Demographics Similar to Scotch-Irish by 2 or more Vehicles in Household
In terms of 2 or more vehicles in household, the demographic groups most similar to Scotch-Irish are Swiss (61.0%, a difference of 0.040%), Immigrants from Vietnam (60.9%, a difference of 0.040%), Korean (61.0%, a difference of 0.070%), Sri Lankan (61.0%, a difference of 0.12%), and White/Caucasian (60.8%, a difference of 0.19%).
| Demographics | Rating | Rank | 2 or more Vehicles in Household |
| Native Hawaiians | 100.0 /100 | #16 | Exceptional 61.4% |
| Basques | 100.0 /100 | #17 | Exceptional 61.4% |
| Europeans | 100.0 /100 | #18 | Exceptional 61.4% |
| Scottish | 100.0 /100 | #19 | Exceptional 61.2% |
| Sri Lankans | 100.0 /100 | #20 | Exceptional 61.0% |
| Koreans | 100.0 /100 | #21 | Exceptional 61.0% |
| Swiss | 100.0 /100 | #22 | Exceptional 61.0% |
| Scotch-Irish | 100.0 /100 | #23 | Exceptional 60.9% |
| Immigrants | Vietnam | 100.0 /100 | #24 | Exceptional 60.9% |
| Whites/Caucasians | 100.0 /100 | #25 | Exceptional 60.8% |
| Welsh | 100.0 /100 | #26 | Exceptional 60.8% |
| Assyrians/Chaldeans/Syriacs | 100.0 /100 | #27 | Exceptional 60.5% |
| Guamanians/Chamorros | 100.0 /100 | #28 | Exceptional 60.5% |
| Hawaiians | 100.0 /100 | #29 | Exceptional 60.4% |
| Finns | 100.0 /100 | #30 | Exceptional 60.3% |