Lebanese vs Immigrants from Greece Female Unemployment

COMPARE

Lebanese
Race
Ancestry
AfghanAfricanAlaska NativeAlaskan AthabascanAlbanianAleutAlsatianAmericanApacheArabArapahoArgentineanArmenianAssyrian/Chaldean/SyriacAustralianAustrianBahamianBangladeshiBarbadianBasqueBelgianBelizeanBermudanBhutaneseBlackfeetBolivianBrazilianBritishBritish West IndianBulgarianBurmeseCajunCambodianCanadianCape VerdeanCarpatho RusynCelticCentral AmericanCentral American IndianCherokeeCheyenneChickasawChileanChineseChippewaChoctawColombianColvilleComancheCosta RicanCreeCreekCroatianCrowCubanCypriotCzechCzechoslovakianDanishDelawareDominicanDutchDutch West IndianEastern EuropeanEcuadorianEgyptianEnglishEstonianEthiopianEuropeanFijianFilipinoFinnishFrenchFrench American IndianFrench CanadianGermanGerman RussianGhanaianGreekGuamanian/ChamorroGuatemalanGuyaneseHaitianHmongHonduranHopiHoumaHungarianIcelanderIndian (Asian)IndonesianInupiatIranianIraqiIrishIroquoisIsraeliItalianJamaicanJapaneseJordanianKenyanKiowaKoreanLaotianLatvianLebaneseLiberianLithuanianLumbeeLuxembourgerMacedonianMalaysianMalteseMarshalleseMenomineeMexicanMexican American IndianMongolianMoroccanNative HawaiianNavajoNepaleseNew ZealanderNicaraguanNigerianNorthern EuropeanNorwegianOkinawanOsageOttawaPaiutePakistaniPalestinianPanamanianParaguayanPennsylvania GermanPeruvianPimaPolishPortuguesePotawatomiPuebloPuerto RicanPuget Sound SalishRomanianRussianSalvadoranSamoanScandinavianScotch-IrishScottishSeminoleSenegaleseSerbianShoshoneSierra LeoneanSiouxSlavicSlovakSloveneSomaliSouth AfricanSouth AmericanSouth American IndianSoviet UnionSpaniardSpanishSpanish AmericanSpanish American IndianSri LankanSubsaharan AfricanSudaneseSwedishSwissSyrianTaiwaneseThaiTlingit-HaidaTohono O'OdhamTonganTrinidadian and TobagonianTsimshianTurkishU.S. Virgin IslanderUgandanUkrainianUruguayanUteVenezuelanVietnameseWelshWest IndianYakamaYaquiYugoslavianYumanYup'ikZimbabwean
Immigration
NonimmigrantsImmigrantsAfghanistanAfricaAlbaniaArgentinaArmeniaAsiaAustraliaAustriaBahamasBangladeshBarbadosBelarusBelgiumBelizeBoliviaBosnia and HerzegovinaBrazilBulgariaBurma/MyanmarCabo VerdeCambodiaCameroonCanadaCaribbeanCentral AmericaChileChinaColombiaCongoCosta RicaCroatiaCubaCzechoslovakiaDenmarkDominicaDominican RepublicEastern AfricaEastern AsiaEastern EuropeEcuadorEgyptEl SalvadorEnglandEritreaEthiopiaEuropeFijiFranceGermanyGhanaGrenadaGuatemalaGuyanaHaitiHondurasHong KongHungaryIndiaIndonesiaIranIraqIrelandIsraelItalyJamaicaJapanJordanKazakhstanKenyaKoreaKuwaitLaosLatin AmericaLatviaLebanonLiberiaLithuaniaMalaysiaMexicoMicronesiaMiddle AfricaMoldovaMoroccoNepalNetherlandsNicaraguaNigeriaNorth AmericaNorth MacedoniaNorthern AfricaNorthern EuropeNorwayOceaniaPakistanPanamaPeruPhilippinesPolandPortugalRomaniaRussiaSaudi ArabiaScotlandSenegalSerbiaSierra LeoneSingaporeSomaliaSouth AfricaSouth AmericaSouth Central AsiaSouth Eastern AsiaSouthern EuropeSpainSri LankaSt. Vincent and the GrenadinesSudanSwedenSwitzerlandSyriaTaiwanThailandTrinidad and TobagoTurkeyUgandaUkraineUruguayUzbekistanVenezuelaVietnamWest IndiesWestern AfricaWestern AsiaWestern EuropeYemenZaireZimbabweAzores
Immigrants from Greece
Race
Ancestry
AfghanAfricanAlaska NativeAlaskan AthabascanAlbanianAleutAlsatianAmericanApacheArabArapahoArgentineanArmenianAssyrian/Chaldean/SyriacAustralianAustrianBahamianBangladeshiBarbadianBasqueBelgianBelizeanBermudanBhutaneseBlackfeetBolivianBrazilianBritishBritish West IndianBulgarianBurmeseCajunCambodianCanadianCape VerdeanCarpatho RusynCelticCentral AmericanCentral American IndianCherokeeCheyenneChickasawChileanChineseChippewaChoctawColombianColvilleComancheCosta RicanCreeCreekCroatianCrowCubanCypriotCzechCzechoslovakianDanishDelawareDominicanDutchDutch West IndianEastern EuropeanEcuadorianEgyptianEnglishEstonianEthiopianEuropeanFijianFilipinoFinnishFrenchFrench American IndianFrench CanadianGermanGerman RussianGhanaianGreekGuamanian/ChamorroGuatemalanGuyaneseHaitianHmongHonduranHopiHoumaHungarianIcelanderIndian (Asian)IndonesianInupiatIranianIraqiIrishIroquoisIsraeliItalianJamaicanJapaneseJordanianKenyanKiowaKoreanLaotianLatvianLiberianLithuanianLumbeeLuxembourgerMacedonianMalaysianMalteseMarshalleseMenomineeMexicanMexican American IndianMongolianMoroccanNative HawaiianNavajoNepaleseNew ZealanderNicaraguanNigerianNorthern EuropeanNorwegianOkinawanOsageOttawaPaiutePakistaniPalestinianPanamanianParaguayanPennsylvania GermanPeruvianPimaPolishPortuguesePotawatomiPuebloPuerto RicanPuget Sound SalishRomanianRussianSalvadoranSamoanScandinavianScotch-IrishScottishSeminoleSenegaleseSerbianShoshoneSierra LeoneanSiouxSlavicSlovakSloveneSomaliSouth AfricanSouth AmericanSouth American IndianSoviet UnionSpaniardSpanishSpanish AmericanSpanish American IndianSri LankanSubsaharan AfricanSudaneseSwedishSwissSyrianTaiwaneseThaiTlingit-HaidaTohono O'OdhamTonganTrinidadian and TobagonianTsimshianTurkishU.S. Virgin IslanderUgandanUkrainianUruguayanUteVenezuelanVietnameseWelshWest IndianYakamaYaquiYugoslavianYumanYup'ikZimbabwean
Immigration
NonimmigrantsImmigrantsAfghanistanAfricaAlbaniaArgentinaArmeniaAsiaAustraliaAustriaBahamasBangladeshBarbadosBelarusBelgiumBelizeBoliviaBosnia and HerzegovinaBrazilBulgariaBurma/MyanmarCabo VerdeCambodiaCameroonCanadaCaribbeanCentral AmericaChileChinaColombiaCongoCosta RicaCroatiaCubaCzechoslovakiaDenmarkDominicaDominican RepublicEastern AfricaEastern AsiaEastern EuropeEcuadorEgyptEl SalvadorEnglandEritreaEthiopiaEuropeFijiFranceGermanyGhanaGreeceGrenadaGuatemalaGuyanaHaitiHondurasHong KongHungaryIndiaIndonesiaIranIraqIrelandIsraelItalyJamaicaJapanJordanKazakhstanKenyaKoreaKuwaitLaosLatin AmericaLatviaLebanonLiberiaLithuaniaMalaysiaMexicoMicronesiaMiddle AfricaMoldovaMoroccoNepalNetherlandsNicaraguaNigeriaNorth AmericaNorth MacedoniaNorthern AfricaNorthern EuropeNorwayOceaniaPakistanPanamaPeruPhilippinesPolandPortugalRomaniaRussiaSaudi ArabiaScotlandSenegalSerbiaSierra LeoneSingaporeSomaliaSouth AfricaSouth AmericaSouth Central AsiaSouth Eastern AsiaSouthern EuropeSpainSri LankaSt. Vincent and the GrenadinesSudanSwedenSwitzerlandSyriaTaiwanThailandTrinidad and TobagoTurkeyUgandaUkraineUruguayUzbekistanVenezuelaVietnamWest IndiesWestern AfricaWestern AsiaWestern EuropeYemenZaireZimbabweAzores
Female Unemployment
Income
Poverty
Unemployment
Labor Participation
Family Structure
Vehicle Availability
Education Level
Disability

Female Unemployment Comparison

Lebanese

Immigrants from Greece

Exceptional
Good
5.1%
FEMALE UNEMPLOYMENT
91.0/ 100
METRIC RATING
115th/ 347
METRIC RANK
5.2%
FEMALE UNEMPLOYMENT
74.9/ 100
METRIC RATING
153rd/ 347
METRIC RANK

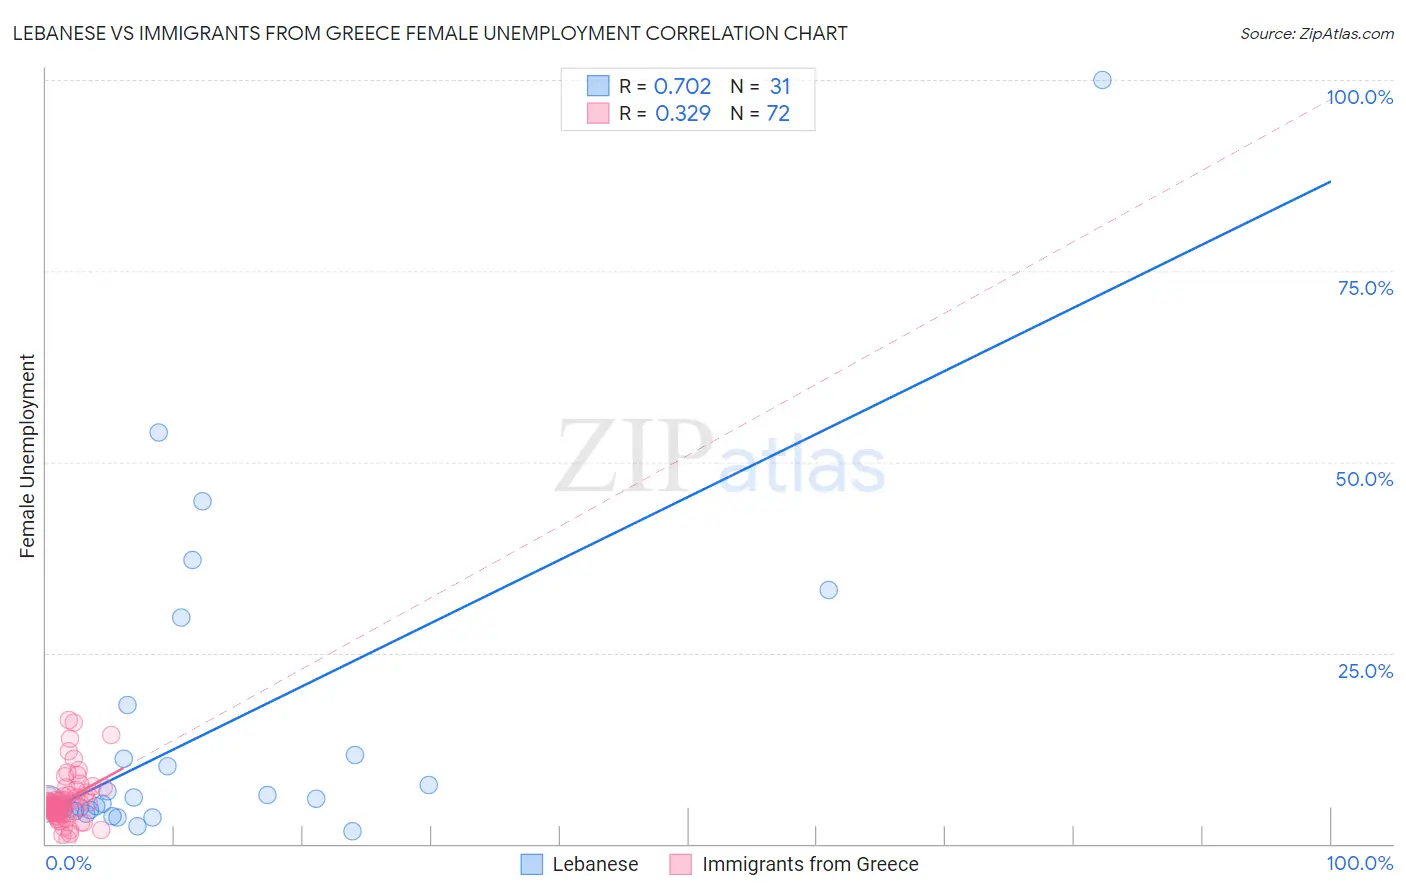
Lebanese vs Immigrants from Greece Female Unemployment Correlation Chart

The statistical analysis conducted on geographies consisting of 399,531,813 people shows a strong positive correlation between the proportion of Lebanese and unemploymnet rate among females in the United States with a correlation coefficient (R) of 0.702 and weighted average of 5.1%. Similarly, the statistical analysis conducted on geographies consisting of 216,457,402 people shows a mild positive correlation between the proportion of Immigrants from Greece and unemploymnet rate among females in the United States with a correlation coefficient (R) of 0.329 and weighted average of 5.2%, a difference of 1.9%.
Lebanese vs Immigrants from Greece Female Unemployment

Female Unemployment Correlation Summary

MeasurementLebaneseImmigrants from Greece
Minimum1.6%0.70%
Maximum100.0%16.2%
Range98.4%15.5%
Mean14.5%5.7%
Median5.2%5.0%
Interquartile 25% (IQ1)4.4%4.0%
Interquartile 75% (IQ3)11.6%6.2%
Interquartile Range (IQR)7.2%2.2%
Standard Deviation (Sample)20.8%3.1%
Standard Deviation (Population)20.5%3.1%

Similar Demographics by Female Unemployment

Demographics Similar to Lebanese by Female Unemployment

In terms of female unemployment, the demographic groups most similar to Lebanese are Immigrants from Turkey (5.1%, a difference of 0.020%), Immigrants from Saudi Arabia (5.1%, a difference of 0.050%), American (5.1%, a difference of 0.080%), Jordanian (5.1%, a difference of 0.12%), and Immigrants from Croatia (5.1%, a difference of 0.18%).
DemographicsRating | RankFemale Unemployment
Puget Sound Salish
93.0
/100
|
#108
Exceptional
5.1%
Immigrants | Eastern Africa
92.8
/100
|
#109
Exceptional
5.1%
Macedonians
92.4
/100
|
#110
Exceptional
5.1%
Immigrants | Burma/Myanmar
92.3
/100
|
#111
Exceptional
5.1%
Estonians
92.1
/100
|
#112
Exceptional
5.1%
Immigrants | Saudi Arabia
91.2
/100
|
#113
Exceptional
5.1%
Immigrants | Turkey
91.0
/100
|
#114
Exceptional
5.1%
Lebanese
91.0
/100
|
#115
Exceptional
5.1%
Americans
90.5
/100
|
#116
Exceptional
5.1%
Jordanians
90.3
/100
|
#117
Exceptional
5.1%
Immigrants | Croatia
89.9
/100
|
#118
Excellent
5.1%
Immigrants | North Macedonia
88.3
/100
|
#119
Excellent
5.1%
Immigrants | Romania
88.1
/100
|
#120
Excellent
5.1%
Immigrants | Western Europe
88.1
/100
|
#121
Excellent
5.1%
Immigrants | Germany
87.6
/100
|
#122
Excellent
5.1%

Demographics Similar to Immigrants from Greece by Female Unemployment

In terms of female unemployment, the demographic groups most similar to Immigrants from Greece are Immigrants from Italy (5.2%, a difference of 0.010%), Immigrants from China (5.2%, a difference of 0.080%), Egyptian (5.2%, a difference of 0.29%), Asian (5.2%, a difference of 0.30%), and South African (5.2%, a difference of 0.32%).
DemographicsRating | RankFemale Unemployment
Immigrants | Norway
79.4
/100
|
#146
Good
5.2%
Argentineans
79.2
/100
|
#147
Good
5.2%
Immigrants | Argentina
78.7
/100
|
#148
Good
5.2%
Asians
78.3
/100
|
#149
Good
5.2%
Egyptians
78.3
/100
|
#150
Good
5.2%
Immigrants | China
75.9
/100
|
#151
Good
5.2%
Immigrants | Italy
75.0
/100
|
#152
Good
5.2%
Immigrants | Greece
74.9
/100
|
#153
Good
5.2%
South Africans
70.8
/100
|
#154
Good
5.2%
Immigrants | Egypt
70.0
/100
|
#155
Good
5.2%
Immigrants | Northern Africa
69.6
/100
|
#156
Good
5.2%
Immigrants | Russia
69.3
/100
|
#157
Good
5.2%
Albanians
68.3
/100
|
#158
Good
5.2%
Immigrants | Micronesia
66.9
/100
|
#159
Good
5.2%
Immigrants | Spain
66.8
/100
|
#160
Good
5.2%