Jordanian vs Immigrants from Nicaragua 2 or more Vehicles in Household
COMPARE
Jordanian
Immigrants from Nicaragua
2 or more Vehicles in Household
2 or more Vehicles in Household Comparison
Jordanians
Immigrants from Nicaragua
57.6%
2 OR MORE VEHICLES IN HOUSEHOLD
98.2/ 100
METRIC RATING
103rd/ 347
METRIC RANK
55.4%
2 OR MORE VEHICLES IN HOUSEHOLD
51.6/ 100
METRIC RATING
172nd/ 347
METRIC RANK
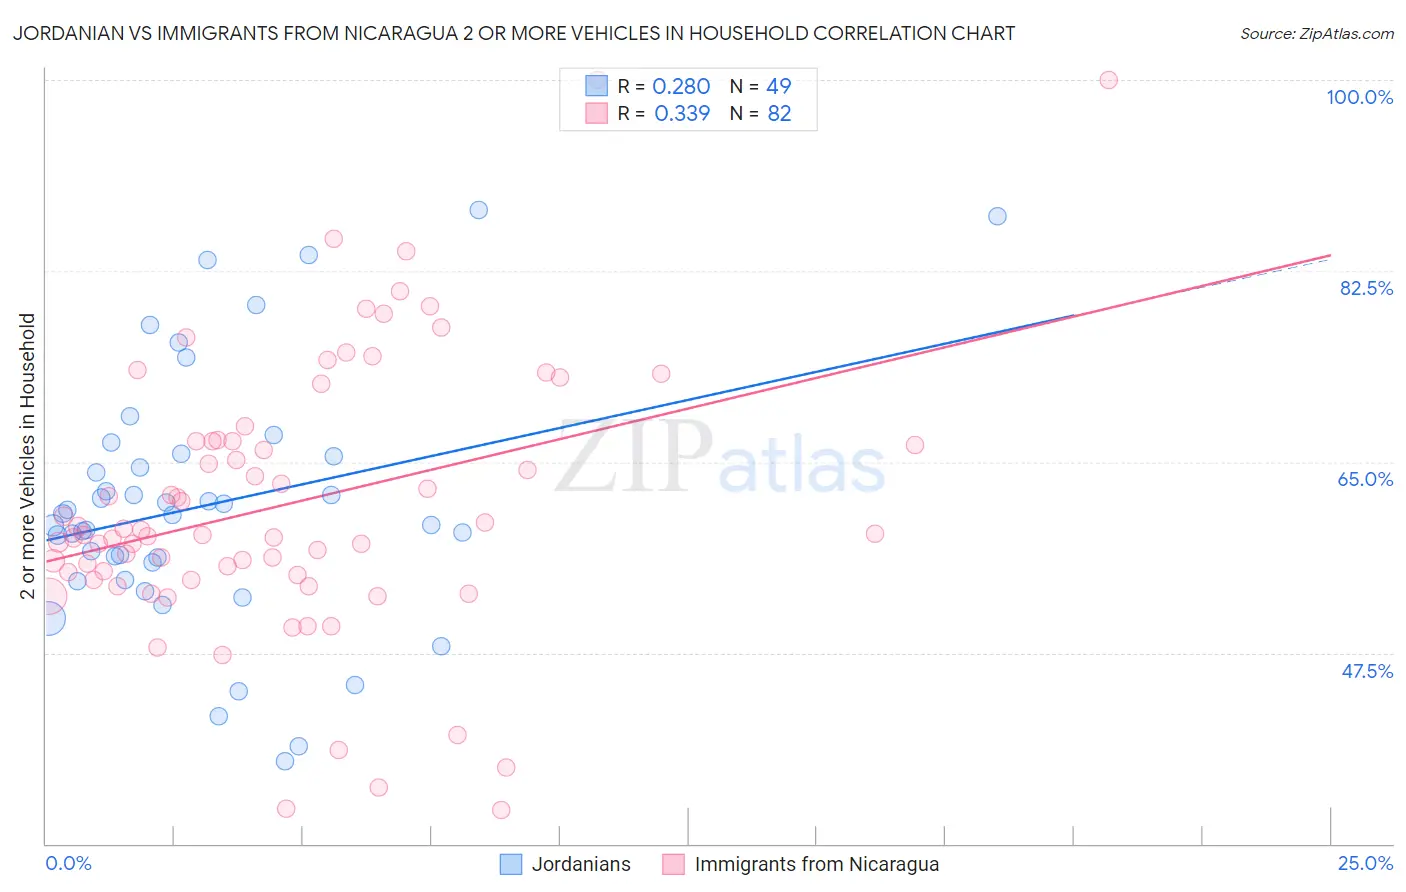
Jordanian vs Immigrants from Nicaragua 2 or more Vehicles in Household Correlation Chart
The statistical analysis conducted on geographies consisting of 166,396,176 people shows a weak positive correlation between the proportion of Jordanians and percentage of households with 2 or more vehicles available in the United States with a correlation coefficient (R) of 0.280 and weighted average of 57.6%. Similarly, the statistical analysis conducted on geographies consisting of 236,314,206 people shows a mild positive correlation between the proportion of Immigrants from Nicaragua and percentage of households with 2 or more vehicles available in the United States with a correlation coefficient (R) of 0.339 and weighted average of 55.4%, a difference of 3.9%.
2 or more Vehicles in Household Correlation Summary
| Measurement | Jordanian | Immigrants from Nicaragua |
| Minimum | 37.6% | 33.1% |
| Maximum | 88.1% | 100.0% |
| Range | 50.5% | 66.9% |
| Mean | 61.0% | 61.2% |
| Median | 60.1% | 58.4% |
| Interquartile 25% (IQ1) | 55.0% | 54.6% |
| Interquartile 75% (IQ3) | 65.6% | 66.9% |
| Interquartile Range (IQR) | 10.6% | 12.3% |
| Standard Deviation (Sample) | 11.5% | 12.7% |
| Standard Deviation (Population) | 11.4% | 12.6% |
Similar Demographics by 2 or more Vehicles in Household
Demographics Similar to Jordanians by 2 or more Vehicles in Household
In terms of 2 or more vehicles in household, the demographic groups most similar to Jordanians are Immigrants from Bolivia (57.6%, a difference of 0.0%), Immigrants from Indonesia (57.6%, a difference of 0.0%), Immigrants from Korea (57.6%, a difference of 0.010%), Immigrants from Oceania (57.5%, a difference of 0.020%), and Immigrants from Netherlands (57.5%, a difference of 0.040%).
| Demographics | Rating | Rank | 2 or more Vehicles in Household |
| Burmese | 98.8 /100 | #96 | Exceptional 57.8% |
| Slavs | 98.8 /100 | #97 | Exceptional 57.8% |
| Palestinians | 98.6 /100 | #98 | Exceptional 57.7% |
| Cajuns | 98.5 /100 | #99 | Exceptional 57.7% |
| Fijians | 98.4 /100 | #100 | Exceptional 57.6% |
| Lebanese | 98.3 /100 | #101 | Exceptional 57.6% |
| Immigrants | Bolivia | 98.2 /100 | #102 | Exceptional 57.6% |
| Jordanians | 98.2 /100 | #103 | Exceptional 57.6% |
| Immigrants | Indonesia | 98.2 /100 | #104 | Exceptional 57.6% |
| Immigrants | Korea | 98.2 /100 | #105 | Exceptional 57.6% |
| Immigrants | Oceania | 98.2 /100 | #106 | Exceptional 57.5% |
| Immigrants | Netherlands | 98.2 /100 | #107 | Exceptional 57.5% |
| Immigrants | Canada | 98.1 /100 | #108 | Exceptional 57.5% |
| Immigrants | North America | 98.1 /100 | #109 | Exceptional 57.5% |
| Japanese | 98.0 /100 | #110 | Exceptional 57.5% |
Demographics Similar to Immigrants from Nicaragua by 2 or more Vehicles in Household
In terms of 2 or more vehicles in household, the demographic groups most similar to Immigrants from Nicaragua are Immigrants from Western Europe (55.4%, a difference of 0.010%), Navajo (55.3%, a difference of 0.070%), Immigrants from Denmark (55.3%, a difference of 0.090%), Immigrants from Costa Rica (55.4%, a difference of 0.11%), and Romanian (55.5%, a difference of 0.17%).
| Demographics | Rating | Rank | 2 or more Vehicles in Household |
| Immigrants | El Salvador | 59.4 /100 | #165 | Average 55.6% |
| Immigrants | Sri Lanka | 58.3 /100 | #166 | Average 55.5% |
| Kenyans | 58.1 /100 | #167 | Average 55.5% |
| French American Indians | 56.7 /100 | #168 | Average 55.5% |
| Immigrants | Austria | 56.3 /100 | #169 | Average 55.5% |
| Romanians | 55.8 /100 | #170 | Average 55.5% |
| Immigrants | Costa Rica | 54.4 /100 | #171 | Average 55.4% |
| Immigrants | Nicaragua | 51.6 /100 | #172 | Average 55.4% |
| Immigrants | Western Europe | 51.4 /100 | #173 | Average 55.4% |
| Navajo | 50.0 /100 | #174 | Average 55.3% |
| Immigrants | Denmark | 49.4 /100 | #175 | Average 55.3% |
| Immigrants | Cuba | 47.0 /100 | #176 | Average 55.3% |
| Menominee | 46.2 /100 | #177 | Average 55.3% |
| Immigrants | Sweden | 45.3 /100 | #178 | Average 55.2% |
| Alaskan Athabascans | 42.9 /100 | #179 | Average 55.2% |