Jordanian vs Yakama 2 or more Vehicles in Household
COMPARE
Jordanian
Yakama
2 or more Vehicles in Household
2 or more Vehicles in Household Comparison
Jordanians
Yakama
57.6%
2 OR MORE VEHICLES IN HOUSEHOLD
98.2/ 100
METRIC RATING
103rd/ 347
METRIC RANK
64.9%
2 OR MORE VEHICLES IN HOUSEHOLD
100.0/ 100
METRIC RATING
1st/ 347
METRIC RANK
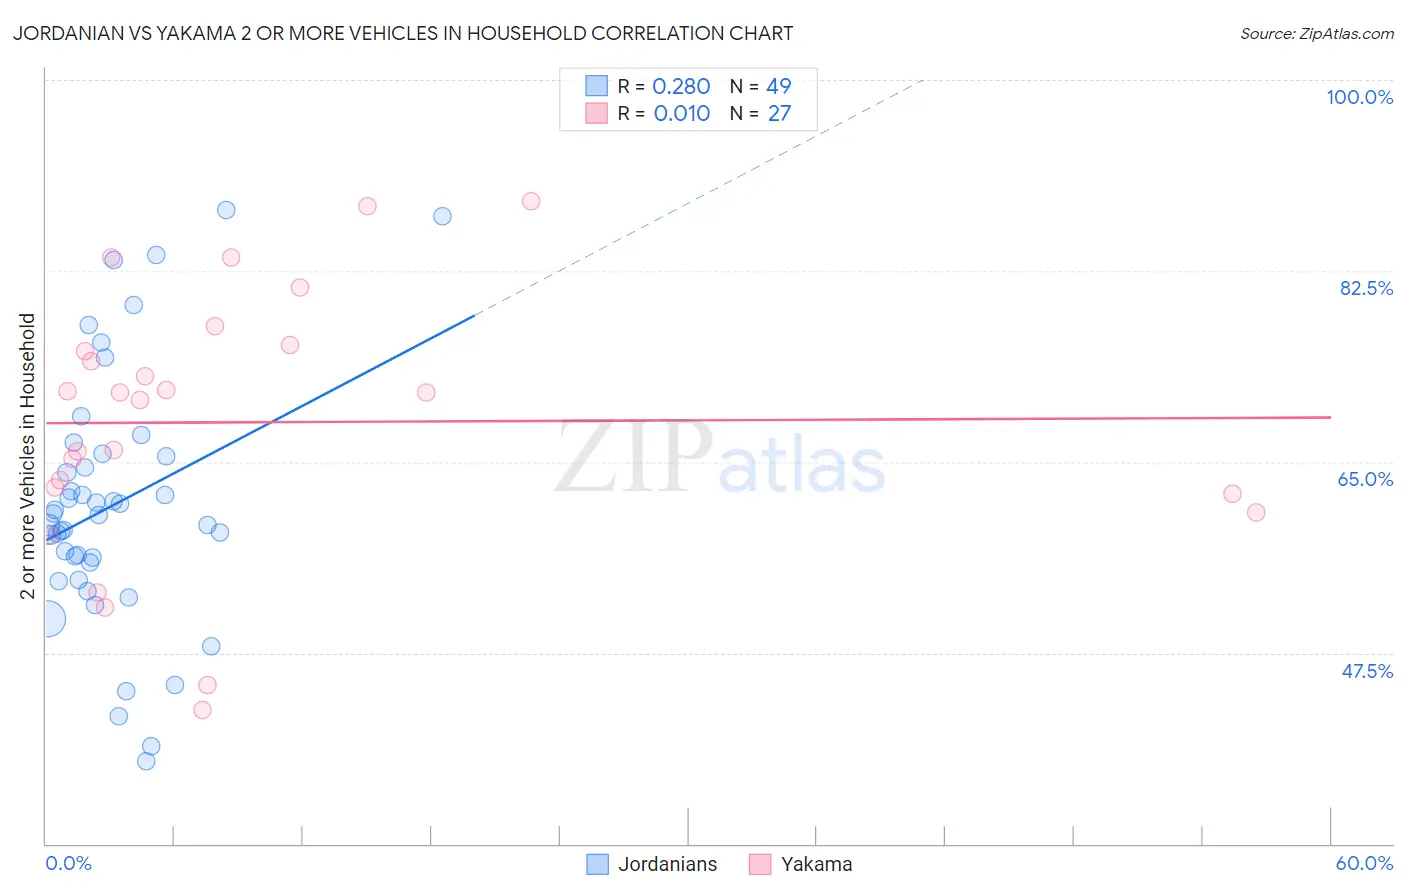
Jordanian vs Yakama 2 or more Vehicles in Household Correlation Chart
The statistical analysis conducted on geographies consisting of 166,396,176 people shows a weak positive correlation between the proportion of Jordanians and percentage of households with 2 or more vehicles available in the United States with a correlation coefficient (R) of 0.280 and weighted average of 57.6%. Similarly, the statistical analysis conducted on geographies consisting of 19,917,879 people shows no correlation between the proportion of Yakama and percentage of households with 2 or more vehicles available in the United States with a correlation coefficient (R) of 0.010 and weighted average of 64.9%, a difference of 12.8%.
2 or more Vehicles in Household Correlation Summary
| Measurement | Jordanian | Yakama |
| Minimum | 37.6% | 42.2% |
| Maximum | 88.1% | 88.9% |
| Range | 50.5% | 46.6% |
| Mean | 61.0% | 68.6% |
| Median | 60.1% | 71.4% |
| Interquartile 25% (IQ1) | 55.0% | 62.1% |
| Interquartile 75% (IQ3) | 65.6% | 75.7% |
| Interquartile Range (IQR) | 10.6% | 13.6% |
| Standard Deviation (Sample) | 11.5% | 12.1% |
| Standard Deviation (Population) | 11.4% | 11.8% |
Similar Demographics by 2 or more Vehicles in Household
Demographics Similar to Jordanians by 2 or more Vehicles in Household
In terms of 2 or more vehicles in household, the demographic groups most similar to Jordanians are Immigrants from Bolivia (57.6%, a difference of 0.0%), Immigrants from Indonesia (57.6%, a difference of 0.0%), Immigrants from Korea (57.6%, a difference of 0.010%), Immigrants from Oceania (57.5%, a difference of 0.020%), and Immigrants from Netherlands (57.5%, a difference of 0.040%).
| Demographics | Rating | Rank | 2 or more Vehicles in Household |
| Burmese | 98.8 /100 | #96 | Exceptional 57.8% |
| Slavs | 98.8 /100 | #97 | Exceptional 57.8% |
| Palestinians | 98.6 /100 | #98 | Exceptional 57.7% |
| Cajuns | 98.5 /100 | #99 | Exceptional 57.7% |
| Fijians | 98.4 /100 | #100 | Exceptional 57.6% |
| Lebanese | 98.3 /100 | #101 | Exceptional 57.6% |
| Immigrants | Bolivia | 98.2 /100 | #102 | Exceptional 57.6% |
| Jordanians | 98.2 /100 | #103 | Exceptional 57.6% |
| Immigrants | Indonesia | 98.2 /100 | #104 | Exceptional 57.6% |
| Immigrants | Korea | 98.2 /100 | #105 | Exceptional 57.6% |
| Immigrants | Oceania | 98.2 /100 | #106 | Exceptional 57.5% |
| Immigrants | Netherlands | 98.2 /100 | #107 | Exceptional 57.5% |
| Immigrants | Canada | 98.1 /100 | #108 | Exceptional 57.5% |
| Immigrants | North America | 98.1 /100 | #109 | Exceptional 57.5% |
| Japanese | 98.0 /100 | #110 | Exceptional 57.5% |
Demographics Similar to Yakama by 2 or more Vehicles in Household
In terms of 2 or more vehicles in household, the demographic groups most similar to Yakama are Tongan (63.5%, a difference of 2.2%), Danish (63.3%, a difference of 2.6%), Norwegian (62.8%, a difference of 3.3%), Immigrants from Fiji (62.3%, a difference of 4.2%), and Scandinavian (62.1%, a difference of 4.5%).
| Demographics | Rating | Rank | 2 or more Vehicles in Household |
| Yakama | 100.0 /100 | #1 | Exceptional 64.9% |
| Tongans | 100.0 /100 | #2 | Exceptional 63.5% |
| Danes | 100.0 /100 | #3 | Exceptional 63.3% |
| Norwegians | 100.0 /100 | #4 | Exceptional 62.8% |
| Immigrants | Fiji | 100.0 /100 | #5 | Exceptional 62.3% |
| Scandinavians | 100.0 /100 | #6 | Exceptional 62.1% |
| Puget Sound Salish | 100.0 /100 | #7 | Exceptional 62.1% |
| English | 100.0 /100 | #8 | Exceptional 61.9% |
| Swedes | 100.0 /100 | #9 | Exceptional 61.8% |
| Mexicans | 100.0 /100 | #10 | Exceptional 61.7% |
| Dutch | 100.0 /100 | #11 | Exceptional 61.6% |
| Germans | 100.0 /100 | #12 | Exceptional 61.6% |
| Samoans | 100.0 /100 | #13 | Exceptional 61.5% |
| Czechs | 100.0 /100 | #14 | Exceptional 61.5% |
| Nepalese | 100.0 /100 | #15 | Exceptional 61.4% |