Jordanian vs South African Female Poverty Among 25-34 Year Olds
COMPARE
Jordanian
South African
Female Poverty Among 25-34 Year Olds
Female Poverty Among 25-34 Year Olds Comparison
Jordanians
South Africans
12.1%
FEMALE POVERTY AMONG 25-34 YEAR OLDS
99.4/ 100
METRIC RATING
57th/ 347
METRIC RANK
13.0%
FEMALE POVERTY AMONG 25-34 YEAR OLDS
85.7/ 100
METRIC RATING
135th/ 347
METRIC RANK
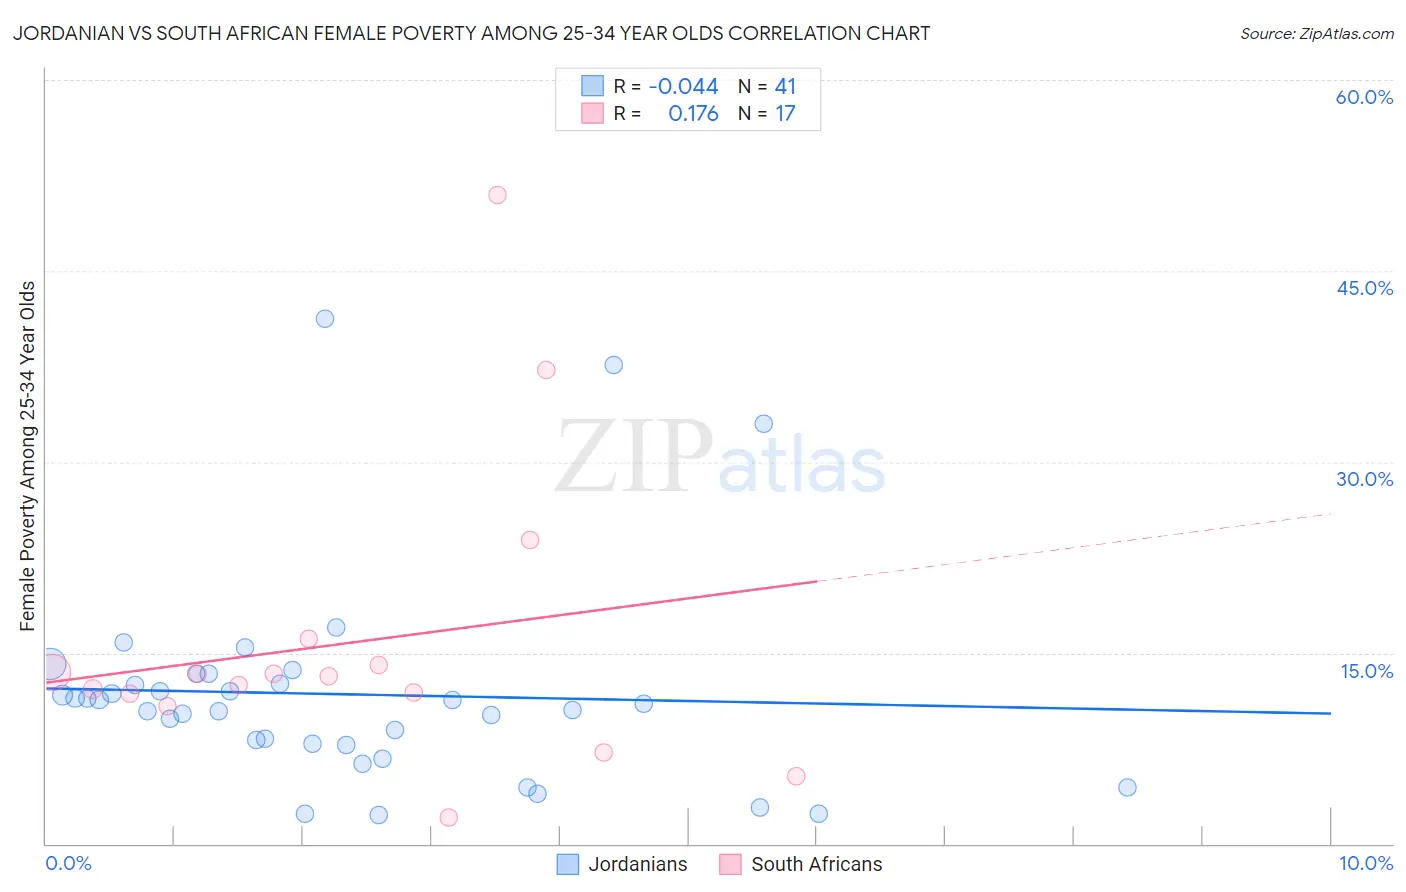
Jordanian vs South African Female Poverty Among 25-34 Year Olds Correlation Chart
The statistical analysis conducted on geographies consisting of 165,610,888 people shows no correlation between the proportion of Jordanians and poverty level among females between the ages 25 and 34 in the United States with a correlation coefficient (R) of -0.044 and weighted average of 12.1%. Similarly, the statistical analysis conducted on geographies consisting of 180,794,089 people shows a poor positive correlation between the proportion of South Africans and poverty level among females between the ages 25 and 34 in the United States with a correlation coefficient (R) of 0.176 and weighted average of 13.0%, a difference of 7.9%.
Female Poverty Among 25-34 Year Olds Correlation Summary
| Measurement | Jordanian | South African |
| Minimum | 2.3% | 2.0% |
| Maximum | 41.2% | 51.0% |
| Range | 39.0% | 49.0% |
| Mean | 11.7% | 15.8% |
| Median | 11.0% | 13.2% |
| Interquartile 25% (IQ1) | 7.8% | 11.3% |
| Interquartile 75% (IQ3) | 13.0% | 15.1% |
| Interquartile Range (IQR) | 5.2% | 3.8% |
| Standard Deviation (Sample) | 8.2% | 11.8% |
| Standard Deviation (Population) | 8.1% | 11.5% |
Similar Demographics by Female Poverty Among 25-34 Year Olds
Demographics Similar to Jordanians by Female Poverty Among 25-34 Year Olds
In terms of female poverty among 25-34 year olds, the demographic groups most similar to Jordanians are Luxembourger (12.1%, a difference of 0.020%), Immigrants from Romania (12.1%, a difference of 0.21%), Russian (12.1%, a difference of 0.21%), Immigrants from Northern Europe (12.1%, a difference of 0.29%), and Immigrants from Czechoslovakia (12.1%, a difference of 0.32%).
| Demographics | Rating | Rank | Female Poverty Among 25-34 Year Olds |
| Immigrants | Croatia | 99.6 /100 | #50 | Exceptional 12.0% |
| Paraguayans | 99.6 /100 | #51 | Exceptional 12.0% |
| Immigrants | Eastern Europe | 99.6 /100 | #52 | Exceptional 12.0% |
| Immigrants | Israel | 99.6 /100 | #53 | Exceptional 12.0% |
| Eastern Europeans | 99.6 /100 | #54 | Exceptional 12.0% |
| Immigrants | Philippines | 99.5 /100 | #55 | Exceptional 12.0% |
| Luxembourgers | 99.5 /100 | #56 | Exceptional 12.1% |
| Jordanians | 99.4 /100 | #57 | Exceptional 12.1% |
| Immigrants | Romania | 99.4 /100 | #58 | Exceptional 12.1% |
| Russians | 99.4 /100 | #59 | Exceptional 12.1% |
| Immigrants | Northern Europe | 99.4 /100 | #60 | Exceptional 12.1% |
| Immigrants | Czechoslovakia | 99.4 /100 | #61 | Exceptional 12.1% |
| Immigrants | Moldova | 99.3 /100 | #62 | Exceptional 12.1% |
| Soviet Union | 99.3 /100 | #63 | Exceptional 12.1% |
| Immigrants | Russia | 99.2 /100 | #64 | Exceptional 12.2% |
Demographics Similar to South Africans by Female Poverty Among 25-34 Year Olds
In terms of female poverty among 25-34 year olds, the demographic groups most similar to South Africans are Afghan (13.0%, a difference of 0.020%), Immigrants from England (13.0%, a difference of 0.020%), Immigrants from Chile (13.1%, a difference of 0.18%), Brazilian (13.1%, a difference of 0.20%), and Austrian (13.1%, a difference of 0.32%).
| Demographics | Rating | Rank | Female Poverty Among 25-34 Year Olds |
| Syrians | 90.2 /100 | #128 | Exceptional 12.9% |
| Immigrants | North America | 89.7 /100 | #129 | Excellent 12.9% |
| Immigrants | Uzbekistan | 89.6 /100 | #130 | Excellent 12.9% |
| Pakistanis | 88.4 /100 | #131 | Excellent 13.0% |
| Immigrants | Hungary | 88.3 /100 | #132 | Excellent 13.0% |
| Serbians | 87.6 /100 | #133 | Excellent 13.0% |
| Afghans | 85.8 /100 | #134 | Excellent 13.0% |
| South Africans | 85.7 /100 | #135 | Excellent 13.0% |
| Immigrants | England | 85.5 /100 | #136 | Excellent 13.0% |
| Immigrants | Chile | 84.6 /100 | #137 | Excellent 13.1% |
| Brazilians | 84.5 /100 | #138 | Excellent 13.1% |
| Austrians | 83.7 /100 | #139 | Excellent 13.1% |
| Immigrants | Iraq | 83.6 /100 | #140 | Excellent 13.1% |
| New Zealanders | 83.4 /100 | #141 | Excellent 13.1% |
| Scandinavians | 82.3 /100 | #142 | Excellent 13.1% |