Japanese vs Immigrants from Jamaica 4 or more Vehicles in Household
COMPARE
Japanese
Immigrants from Jamaica
4 or more Vehicles in Household
4 or more Vehicles in Household Comparison
Japanese
Immigrants from Jamaica
7.7%
4 OR MORE VEHICLES IN HOUSEHOLD
100.0/ 100
METRIC RATING
52nd/ 347
METRIC RANK
4.4%
4 OR MORE VEHICLES IN HOUSEHOLD
0.0/ 100
METRIC RATING
325th/ 347
METRIC RANK
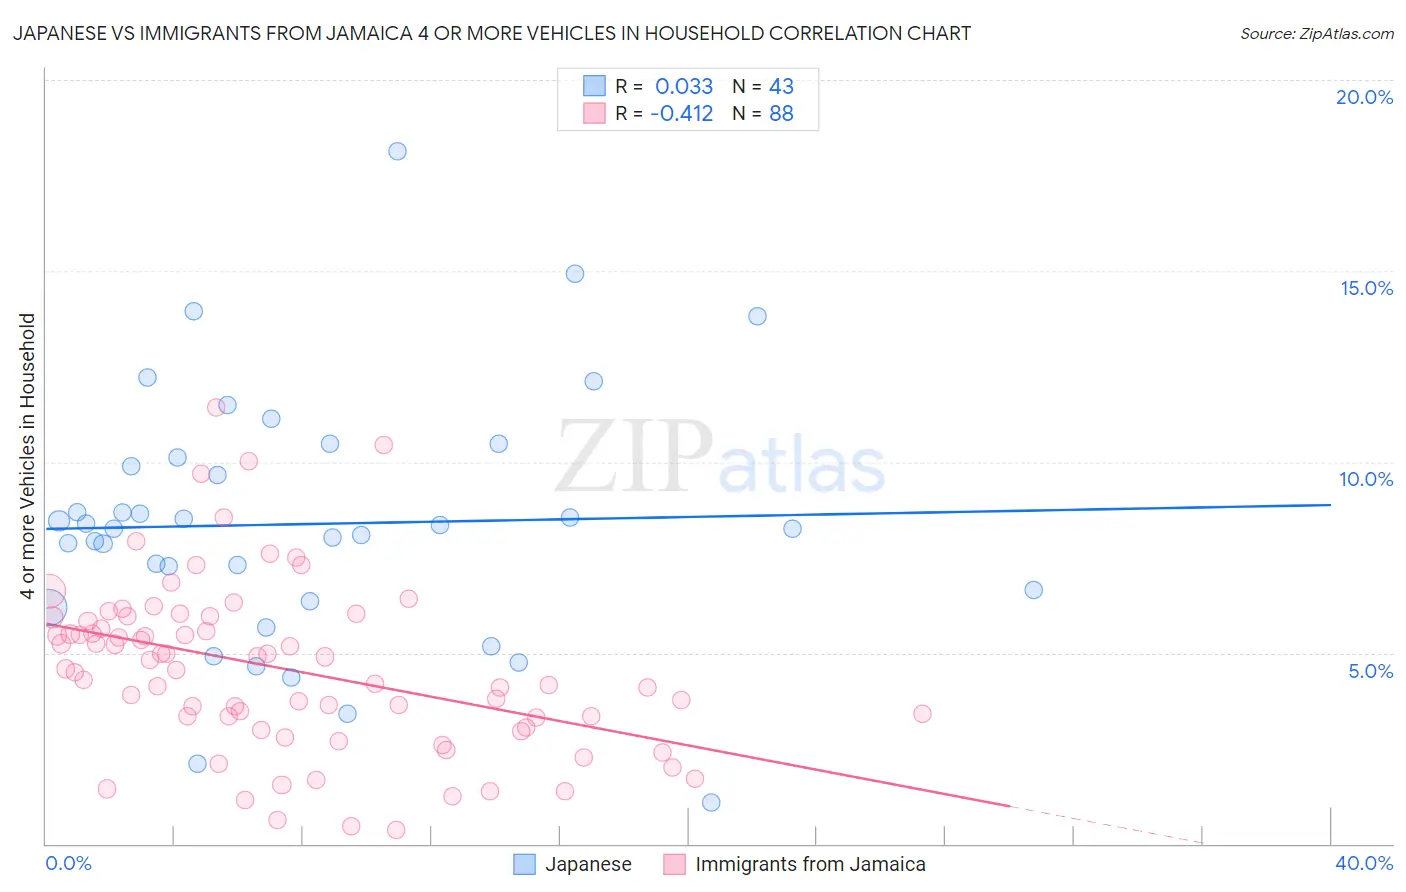
Japanese vs Immigrants from Jamaica 4 or more Vehicles in Household Correlation Chart
The statistical analysis conducted on geographies consisting of 248,680,016 people shows no correlation between the proportion of Japanese and percentage of households with 4 or more vehicles available in the United States with a correlation coefficient (R) of 0.033 and weighted average of 7.7%. Similarly, the statistical analysis conducted on geographies consisting of 300,147,044 people shows a moderate negative correlation between the proportion of Immigrants from Jamaica and percentage of households with 4 or more vehicles available in the United States with a correlation coefficient (R) of -0.412 and weighted average of 4.4%, a difference of 74.4%.
4 or more Vehicles in Household Correlation Summary
| Measurement | Japanese | Immigrants from Jamaica |
| Minimum | 1.1% | 0.36% |
| Maximum | 18.1% | 11.4% |
| Range | 17.0% | 11.1% |
| Mean | 8.4% | 4.6% |
| Median | 8.3% | 4.6% |
| Interquartile 25% (IQ1) | 6.3% | 3.2% |
| Interquartile 75% (IQ3) | 10.1% | 5.9% |
| Interquartile Range (IQR) | 3.8% | 2.7% |
| Standard Deviation (Sample) | 3.3% | 2.2% |
| Standard Deviation (Population) | 3.3% | 2.2% |
Similar Demographics by 4 or more Vehicles in Household
Demographics Similar to Japanese by 4 or more Vehicles in Household
In terms of 4 or more vehicles in household, the demographic groups most similar to Japanese are Immigrants from Laos (7.7%, a difference of 0.12%), Malaysian (7.7%, a difference of 0.38%), Dutch (7.7%, a difference of 0.46%), Immigrants from El Salvador (7.7%, a difference of 0.47%), and Cherokee (7.7%, a difference of 0.63%).
| Demographics | Rating | Rank | 4 or more Vehicles in Household |
| Choctaw | 100.0 /100 | #45 | Exceptional 7.8% |
| Crow | 100.0 /100 | #46 | Exceptional 7.8% |
| Osage | 100.0 /100 | #47 | Exceptional 7.8% |
| Swiss | 100.0 /100 | #48 | Exceptional 7.8% |
| Cherokee | 100.0 /100 | #49 | Exceptional 7.7% |
| Immigrants | El Salvador | 100.0 /100 | #50 | Exceptional 7.7% |
| Immigrants | Laos | 100.0 /100 | #51 | Exceptional 7.7% |
| Japanese | 100.0 /100 | #52 | Exceptional 7.7% |
| Malaysians | 100.0 /100 | #53 | Exceptional 7.7% |
| Dutch | 100.0 /100 | #54 | Exceptional 7.7% |
| Immigrants | Oceania | 100.0 /100 | #55 | Exceptional 7.6% |
| English | 100.0 /100 | #56 | Exceptional 7.6% |
| Pennsylvania Germans | 100.0 /100 | #57 | Exceptional 7.6% |
| Swedes | 100.0 /100 | #58 | Exceptional 7.6% |
| Hispanics or Latinos | 100.0 /100 | #59 | Exceptional 7.6% |
Demographics Similar to Immigrants from Jamaica by 4 or more Vehicles in Household
In terms of 4 or more vehicles in household, the demographic groups most similar to Immigrants from Jamaica are Soviet Union (4.4%, a difference of 0.32%), Cape Verdean (4.4%, a difference of 0.32%), Immigrants from Caribbean (4.4%, a difference of 0.60%), Immigrants from Yemen (4.5%, a difference of 1.0%), and Ecuadorian (4.5%, a difference of 1.2%).
| Demographics | Rating | Rank | 4 or more Vehicles in Household |
| Jamaicans | 0.0 /100 | #318 | Tragic 4.6% |
| Haitians | 0.0 /100 | #319 | Tragic 4.6% |
| Immigrants | Haiti | 0.0 /100 | #320 | Tragic 4.5% |
| Ecuadorians | 0.0 /100 | #321 | Tragic 4.5% |
| Immigrants | Yemen | 0.0 /100 | #322 | Tragic 4.5% |
| Immigrants | Caribbean | 0.0 /100 | #323 | Tragic 4.4% |
| Soviet Union | 0.0 /100 | #324 | Tragic 4.4% |
| Immigrants | Jamaica | 0.0 /100 | #325 | Tragic 4.4% |
| Cape Verdeans | 0.0 /100 | #326 | Tragic 4.4% |
| Senegalese | 0.0 /100 | #327 | Tragic 4.3% |
| Trinidadians and Tobagonians | 0.0 /100 | #328 | Tragic 4.3% |
| Immigrants | Senegal | 0.0 /100 | #329 | Tragic 4.2% |
| Immigrants | Ecuador | 0.0 /100 | #330 | Tragic 4.2% |
| West Indians | 0.0 /100 | #331 | Tragic 4.2% |
| Immigrants | Dominica | 0.0 /100 | #332 | Tragic 4.2% |