Japanese vs Immigrants from Barbados 4 or more Vehicles in Household
COMPARE
Japanese
Immigrants from Barbados
4 or more Vehicles in Household
4 or more Vehicles in Household Comparison
Japanese
Immigrants from Barbados
7.7%
4 OR MORE VEHICLES IN HOUSEHOLD
100.0/ 100
METRIC RATING
52nd/ 347
METRIC RANK
3.6%
4 OR MORE VEHICLES IN HOUSEHOLD
0.0/ 100
METRIC RATING
340th/ 347
METRIC RANK
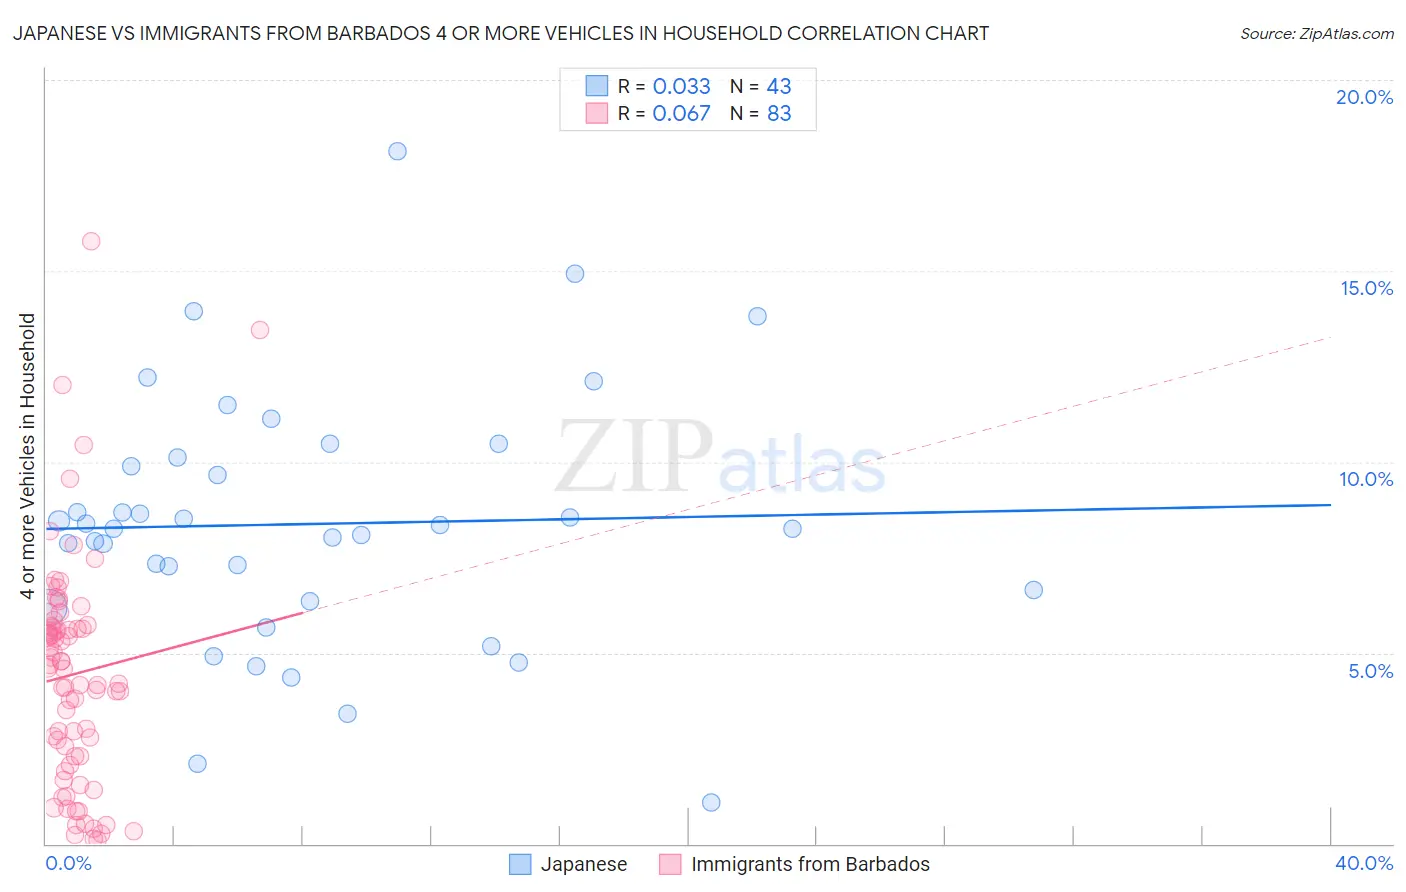
Japanese vs Immigrants from Barbados 4 or more Vehicles in Household Correlation Chart
The statistical analysis conducted on geographies consisting of 248,680,016 people shows no correlation between the proportion of Japanese and percentage of households with 4 or more vehicles available in the United States with a correlation coefficient (R) of 0.033 and weighted average of 7.7%. Similarly, the statistical analysis conducted on geographies consisting of 112,222,140 people shows a slight positive correlation between the proportion of Immigrants from Barbados and percentage of households with 4 or more vehicles available in the United States with a correlation coefficient (R) of 0.067 and weighted average of 3.6%, a difference of 113.3%.
4 or more Vehicles in Household Correlation Summary
| Measurement | Japanese | Immigrants from Barbados |
| Minimum | 1.1% | 0.11% |
| Maximum | 18.1% | 15.8% |
| Range | 17.0% | 15.7% |
| Mean | 8.4% | 4.4% |
| Median | 8.3% | 4.6% |
| Interquartile 25% (IQ1) | 6.3% | 2.3% |
| Interquartile 75% (IQ3) | 10.1% | 5.7% |
| Interquartile Range (IQR) | 3.8% | 3.4% |
| Standard Deviation (Sample) | 3.3% | 3.0% |
| Standard Deviation (Population) | 3.3% | 2.9% |
Similar Demographics by 4 or more Vehicles in Household
Demographics Similar to Japanese by 4 or more Vehicles in Household
In terms of 4 or more vehicles in household, the demographic groups most similar to Japanese are Immigrants from Laos (7.7%, a difference of 0.12%), Malaysian (7.7%, a difference of 0.38%), Dutch (7.7%, a difference of 0.46%), Immigrants from El Salvador (7.7%, a difference of 0.47%), and Cherokee (7.7%, a difference of 0.63%).
| Demographics | Rating | Rank | 4 or more Vehicles in Household |
| Choctaw | 100.0 /100 | #45 | Exceptional 7.8% |
| Crow | 100.0 /100 | #46 | Exceptional 7.8% |
| Osage | 100.0 /100 | #47 | Exceptional 7.8% |
| Swiss | 100.0 /100 | #48 | Exceptional 7.8% |
| Cherokee | 100.0 /100 | #49 | Exceptional 7.7% |
| Immigrants | El Salvador | 100.0 /100 | #50 | Exceptional 7.7% |
| Immigrants | Laos | 100.0 /100 | #51 | Exceptional 7.7% |
| Japanese | 100.0 /100 | #52 | Exceptional 7.7% |
| Malaysians | 100.0 /100 | #53 | Exceptional 7.7% |
| Dutch | 100.0 /100 | #54 | Exceptional 7.7% |
| Immigrants | Oceania | 100.0 /100 | #55 | Exceptional 7.6% |
| English | 100.0 /100 | #56 | Exceptional 7.6% |
| Pennsylvania Germans | 100.0 /100 | #57 | Exceptional 7.6% |
| Swedes | 100.0 /100 | #58 | Exceptional 7.6% |
| Hispanics or Latinos | 100.0 /100 | #59 | Exceptional 7.6% |
Demographics Similar to Immigrants from Barbados by 4 or more Vehicles in Household
In terms of 4 or more vehicles in household, the demographic groups most similar to Immigrants from Barbados are Immigrants from Uzbekistan (3.6%, a difference of 0.55%), Dominican (3.5%, a difference of 2.8%), Guyanese (3.5%, a difference of 3.5%), British West Indian (3.5%, a difference of 4.5%), and Immigrants from Cabo Verde (3.8%, a difference of 5.6%).
| Demographics | Rating | Rank | 4 or more Vehicles in Household |
| Immigrants | Albania | 0.0 /100 | #333 | Tragic 4.1% |
| Immigrants | Trinidad and Tobago | 0.0 /100 | #334 | Tragic 4.1% |
| Barbadians | 0.0 /100 | #335 | Tragic 3.9% |
| Immigrants | Bangladesh | 0.0 /100 | #336 | Tragic 3.9% |
| Vietnamese | 0.0 /100 | #337 | Tragic 3.9% |
| Immigrants | Cabo Verde | 0.0 /100 | #338 | Tragic 3.8% |
| Immigrants | Uzbekistan | 0.0 /100 | #339 | Tragic 3.6% |
| Immigrants | Barbados | 0.0 /100 | #340 | Tragic 3.6% |
| Dominicans | 0.0 /100 | #341 | Tragic 3.5% |
| Guyanese | 0.0 /100 | #342 | Tragic 3.5% |
| British West Indians | 0.0 /100 | #343 | Tragic 3.5% |
| Immigrants | Guyana | 0.0 /100 | #344 | Tragic 3.4% |
| Immigrants | Dominican Republic | 0.0 /100 | #345 | Tragic 3.3% |
| Immigrants | St. Vincent and the Grenadines | 0.0 /100 | #346 | Tragic 3.0% |
| Immigrants | Grenada | 0.0 /100 | #347 | Tragic 2.7% |