Japanese vs Immigrants from Jamaica Per Capita Income
COMPARE
Japanese
Immigrants from Jamaica
Per Capita Income
Per Capita Income Comparison
Japanese
Immigrants from Jamaica
$39,870
PER CAPITA INCOME
1.4/ 100
METRIC RATING
249th/ 347
METRIC RANK
$38,766
PER CAPITA INCOME
0.4/ 100
METRIC RATING
269th/ 347
METRIC RANK
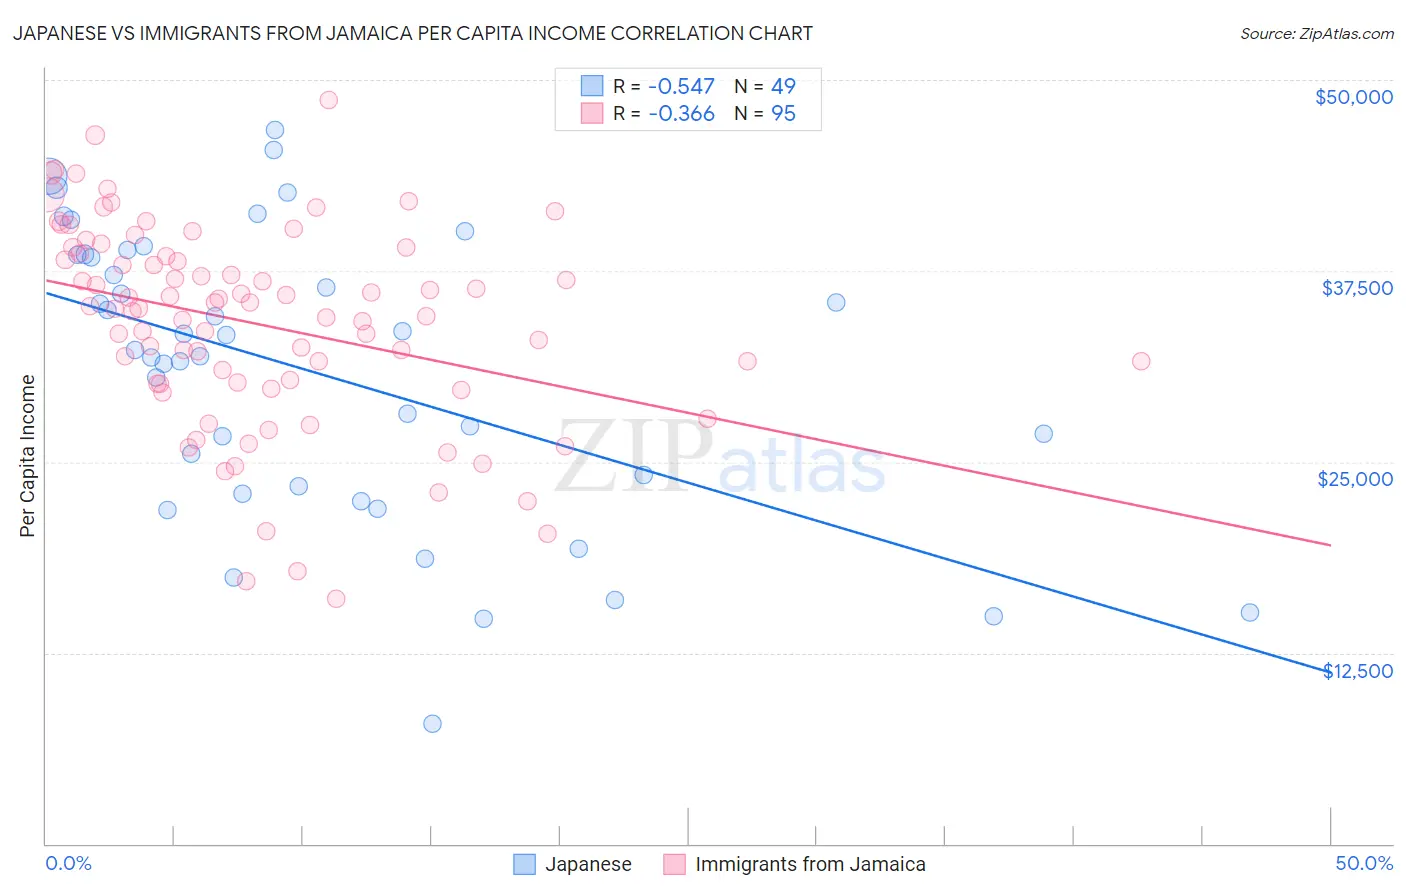
Japanese vs Immigrants from Jamaica Per Capita Income Correlation Chart
The statistical analysis conducted on geographies consisting of 249,192,968 people shows a substantial negative correlation between the proportion of Japanese and per capita income in the United States with a correlation coefficient (R) of -0.547 and weighted average of $39,870. Similarly, the statistical analysis conducted on geographies consisting of 301,814,943 people shows a mild negative correlation between the proportion of Immigrants from Jamaica and per capita income in the United States with a correlation coefficient (R) of -0.366 and weighted average of $38,766, a difference of 2.9%.
Per Capita Income Correlation Summary
| Measurement | Japanese | Immigrants from Jamaica |
| Minimum | $7,849 | $16,033 |
| Maximum | $46,714 | $48,680 |
| Range | $38,865 | $32,647 |
| Mean | $30,879 | $34,027 |
| Median | $32,329 | $35,066 |
| Interquartile 25% (IQ1) | $23,174 | $30,104 |
| Interquartile 75% (IQ3) | $38,578 | $38,633 |
| Interquartile Range (IQR) | $15,404 | $8,529 |
| Standard Deviation (Sample) | $9,433 | $6,626 |
| Standard Deviation (Population) | $9,336 | $6,591 |
Demographics Similar to Japanese and Immigrants from Jamaica by Per Capita Income
In terms of per capita income, the demographic groups most similar to Japanese are Immigrants from Burma/Myanmar ($39,827, a difference of 0.11%), Samoan ($39,826, a difference of 0.11%), Immigrants from the Azores ($39,608, a difference of 0.66%), Osage ($39,568, a difference of 0.76%), and Alaska Native ($39,558, a difference of 0.79%). Similarly, the demographic groups most similar to Immigrants from Jamaica are Liberian ($38,780, a difference of 0.040%), Immigrants from Zaire ($38,848, a difference of 0.21%), Salvadoran ($38,858, a difference of 0.24%), Spanish American ($39,012, a difference of 0.64%), and American ($39,039, a difference of 0.71%).
| Demographics | Rating | Rank | Per Capita Income |
| Japanese | 1.4 /100 | #249 | Tragic $39,870 |
| Immigrants | Burma/Myanmar | 1.3 /100 | #250 | Tragic $39,827 |
| Samoans | 1.3 /100 | #251 | Tragic $39,826 |
| Immigrants | Azores | 1.0 /100 | #252 | Tragic $39,608 |
| Osage | 1.0 /100 | #253 | Tragic $39,568 |
| Alaska Natives | 1.0 /100 | #254 | Tragic $39,558 |
| Immigrants | Middle Africa | 1.0 /100 | #255 | Tragic $39,529 |
| Hawaiians | 0.8 /100 | #256 | Tragic $39,403 |
| Nicaraguans | 0.8 /100 | #257 | Tragic $39,372 |
| Jamaicans | 0.7 /100 | #258 | Tragic $39,231 |
| Malaysians | 0.7 /100 | #259 | Tragic $39,194 |
| Alaskan Athabascans | 0.6 /100 | #260 | Tragic $39,163 |
| Marshallese | 0.6 /100 | #261 | Tragic $39,108 |
| Iroquois | 0.6 /100 | #262 | Tragic $39,104 |
| Belizeans | 0.6 /100 | #263 | Tragic $39,097 |
| Americans | 0.6 /100 | #264 | Tragic $39,039 |
| Spanish Americans | 0.5 /100 | #265 | Tragic $39,012 |
| Salvadorans | 0.5 /100 | #266 | Tragic $38,858 |
| Immigrants | Zaire | 0.4 /100 | #267 | Tragic $38,848 |
| Liberians | 0.4 /100 | #268 | Tragic $38,780 |
| Immigrants | Jamaica | 0.4 /100 | #269 | Tragic $38,766 |