Immigrants from Kazakhstan vs Immigrants from Jamaica 4 or more Vehicles in Household
COMPARE
Immigrants from Kazakhstan
Immigrants from Jamaica
4 or more Vehicles in Household
4 or more Vehicles in Household Comparison
Immigrants from Kazakhstan
Immigrants from Jamaica
5.5%
4 OR MORE VEHICLES IN HOUSEHOLD
0.6/ 100
METRIC RATING
272nd/ 347
METRIC RANK
4.4%
4 OR MORE VEHICLES IN HOUSEHOLD
0.0/ 100
METRIC RATING
325th/ 347
METRIC RANK
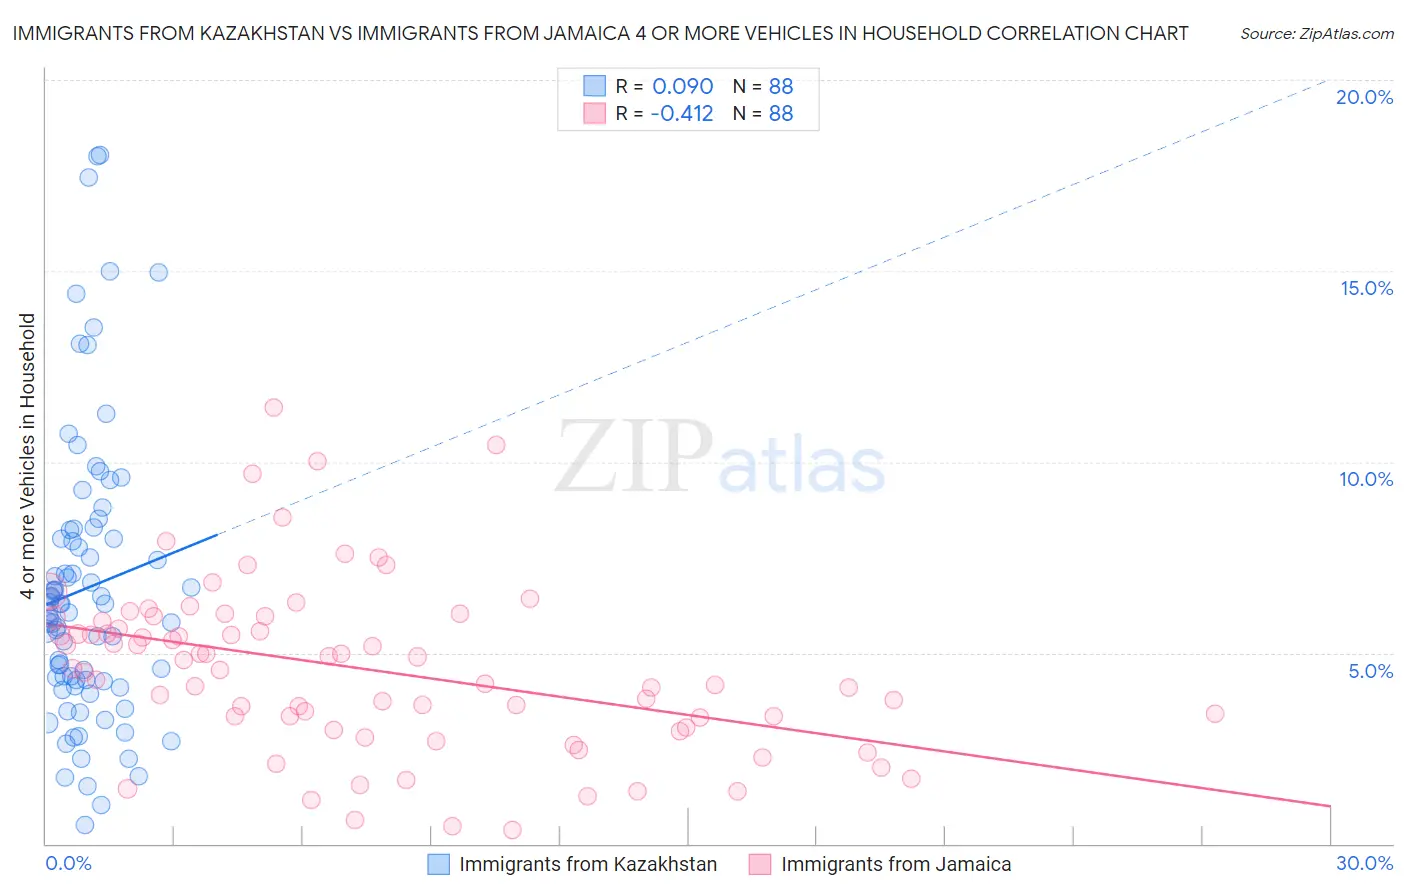
Immigrants from Kazakhstan vs Immigrants from Jamaica 4 or more Vehicles in Household Correlation Chart
The statistical analysis conducted on geographies consisting of 124,145,128 people shows a slight positive correlation between the proportion of Immigrants from Kazakhstan and percentage of households with 4 or more vehicles available in the United States with a correlation coefficient (R) of 0.090 and weighted average of 5.5%. Similarly, the statistical analysis conducted on geographies consisting of 300,147,044 people shows a moderate negative correlation between the proportion of Immigrants from Jamaica and percentage of households with 4 or more vehicles available in the United States with a correlation coefficient (R) of -0.412 and weighted average of 4.4%, a difference of 24.7%.
4 or more Vehicles in Household Correlation Summary
| Measurement | Immigrants from Kazakhstan | Immigrants from Jamaica |
| Minimum | 0.50% | 0.36% |
| Maximum | 18.0% | 11.4% |
| Range | 17.5% | 11.1% |
| Mean | 6.7% | 4.6% |
| Median | 6.2% | 4.6% |
| Interquartile 25% (IQ1) | 4.3% | 3.2% |
| Interquartile 75% (IQ3) | 8.1% | 5.9% |
| Interquartile Range (IQR) | 3.8% | 2.7% |
| Standard Deviation (Sample) | 3.8% | 2.2% |
| Standard Deviation (Population) | 3.7% | 2.2% |
Similar Demographics by 4 or more Vehicles in Household
Demographics Similar to Immigrants from Kazakhstan by 4 or more Vehicles in Household
In terms of 4 or more vehicles in household, the demographic groups most similar to Immigrants from Kazakhstan are Macedonian (5.5%, a difference of 0.030%), Black/African American (5.5%, a difference of 0.15%), Immigrants from Sudan (5.5%, a difference of 0.19%), Cambodian (5.5%, a difference of 0.27%), and Immigrants from Latvia (5.5%, a difference of 0.28%).
| Demographics | Rating | Rank | 4 or more Vehicles in Household |
| South Americans | 0.9 /100 | #265 | Tragic 5.6% |
| Immigrants | Nepal | 0.9 /100 | #266 | Tragic 5.6% |
| Immigrants | Ukraine | 0.9 /100 | #267 | Tragic 5.6% |
| Colombians | 0.7 /100 | #268 | Tragic 5.5% |
| Carpatho Rusyns | 0.7 /100 | #269 | Tragic 5.5% |
| Okinawans | 0.6 /100 | #270 | Tragic 5.5% |
| Immigrants | Sudan | 0.6 /100 | #271 | Tragic 5.5% |
| Immigrants | Kazakhstan | 0.6 /100 | #272 | Tragic 5.5% |
| Macedonians | 0.6 /100 | #273 | Tragic 5.5% |
| Blacks/African Americans | 0.6 /100 | #274 | Tragic 5.5% |
| Cambodians | 0.5 /100 | #275 | Tragic 5.5% |
| Immigrants | Latvia | 0.5 /100 | #276 | Tragic 5.5% |
| Immigrants | Bulgaria | 0.5 /100 | #277 | Tragic 5.5% |
| Immigrants | Eastern Europe | 0.4 /100 | #278 | Tragic 5.4% |
| Immigrants | Uruguay | 0.3 /100 | #279 | Tragic 5.4% |
Demographics Similar to Immigrants from Jamaica by 4 or more Vehicles in Household
In terms of 4 or more vehicles in household, the demographic groups most similar to Immigrants from Jamaica are Soviet Union (4.4%, a difference of 0.32%), Cape Verdean (4.4%, a difference of 0.32%), Immigrants from Caribbean (4.4%, a difference of 0.60%), Immigrants from Yemen (4.5%, a difference of 1.0%), and Ecuadorian (4.5%, a difference of 1.2%).
| Demographics | Rating | Rank | 4 or more Vehicles in Household |
| Jamaicans | 0.0 /100 | #318 | Tragic 4.6% |
| Haitians | 0.0 /100 | #319 | Tragic 4.6% |
| Immigrants | Haiti | 0.0 /100 | #320 | Tragic 4.5% |
| Ecuadorians | 0.0 /100 | #321 | Tragic 4.5% |
| Immigrants | Yemen | 0.0 /100 | #322 | Tragic 4.5% |
| Immigrants | Caribbean | 0.0 /100 | #323 | Tragic 4.4% |
| Soviet Union | 0.0 /100 | #324 | Tragic 4.4% |
| Immigrants | Jamaica | 0.0 /100 | #325 | Tragic 4.4% |
| Cape Verdeans | 0.0 /100 | #326 | Tragic 4.4% |
| Senegalese | 0.0 /100 | #327 | Tragic 4.3% |
| Trinidadians and Tobagonians | 0.0 /100 | #328 | Tragic 4.3% |
| Immigrants | Senegal | 0.0 /100 | #329 | Tragic 4.2% |
| Immigrants | Ecuador | 0.0 /100 | #330 | Tragic 4.2% |
| West Indians | 0.0 /100 | #331 | Tragic 4.2% |
| Immigrants | Dominica | 0.0 /100 | #332 | Tragic 4.2% |