Alaska Native vs Immigrants from Jamaica 4 or more Vehicles in Household
COMPARE
Alaska Native
Immigrants from Jamaica
4 or more Vehicles in Household
4 or more Vehicles in Household Comparison
Alaska Natives
Immigrants from Jamaica
7.3%
4 OR MORE VEHICLES IN HOUSEHOLD
99.8/ 100
METRIC RATING
80th/ 347
METRIC RANK
4.4%
4 OR MORE VEHICLES IN HOUSEHOLD
0.0/ 100
METRIC RATING
325th/ 347
METRIC RANK
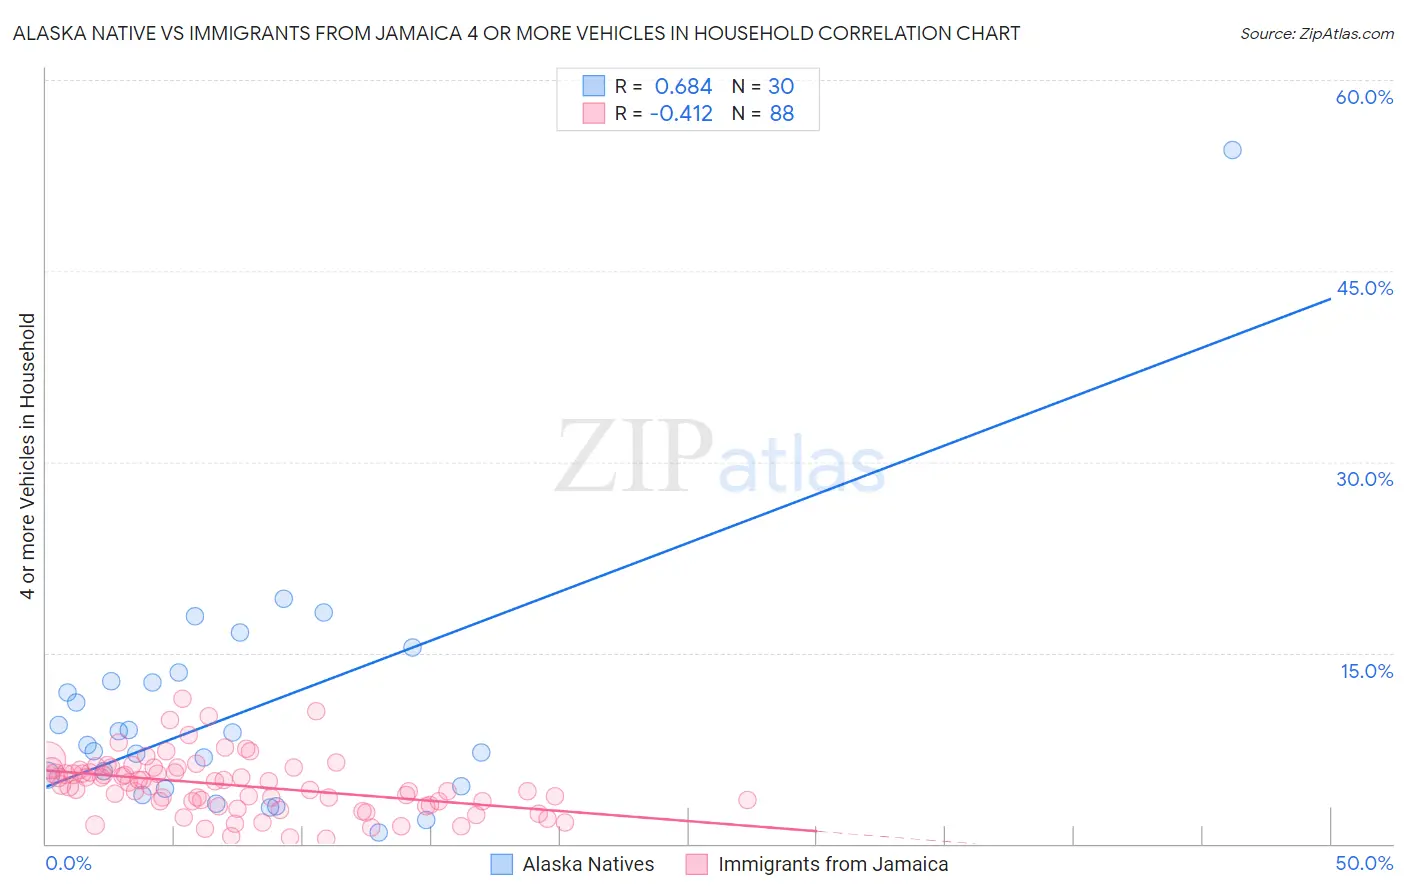
Alaska Native vs Immigrants from Jamaica 4 or more Vehicles in Household Correlation Chart
The statistical analysis conducted on geographies consisting of 76,511,900 people shows a significant positive correlation between the proportion of Alaska Natives and percentage of households with 4 or more vehicles available in the United States with a correlation coefficient (R) of 0.684 and weighted average of 7.3%. Similarly, the statistical analysis conducted on geographies consisting of 300,147,044 people shows a moderate negative correlation between the proportion of Immigrants from Jamaica and percentage of households with 4 or more vehicles available in the United States with a correlation coefficient (R) of -0.412 and weighted average of 4.4%, a difference of 66.4%.
4 or more Vehicles in Household Correlation Summary
| Measurement | Alaska Native | Immigrants from Jamaica |
| Minimum | 0.90% | 0.36% |
| Maximum | 54.5% | 11.4% |
| Range | 53.6% | 11.1% |
| Mean | 10.4% | 4.6% |
| Median | 8.3% | 4.6% |
| Interquartile 25% (IQ1) | 4.5% | 3.2% |
| Interquartile 75% (IQ3) | 12.7% | 5.9% |
| Interquartile Range (IQR) | 8.2% | 2.7% |
| Standard Deviation (Sample) | 9.8% | 2.2% |
| Standard Deviation (Population) | 9.6% | 2.2% |
Similar Demographics by 4 or more Vehicles in Household
Demographics Similar to Alaska Natives by 4 or more Vehicles in Household
In terms of 4 or more vehicles in household, the demographic groups most similar to Alaska Natives are Czech (7.4%, a difference of 0.14%), White/Caucasian (7.4%, a difference of 0.31%), Apache (7.4%, a difference of 0.38%), Laotian (7.4%, a difference of 0.54%), and Finnish (7.3%, a difference of 0.56%).
| Demographics | Rating | Rank | 4 or more Vehicles in Household |
| Portuguese | 99.9 /100 | #73 | Exceptional 7.4% |
| Icelanders | 99.9 /100 | #74 | Exceptional 7.4% |
| Immigrants | Cambodia | 99.9 /100 | #75 | Exceptional 7.4% |
| Laotians | 99.9 /100 | #76 | Exceptional 7.4% |
| Apache | 99.9 /100 | #77 | Exceptional 7.4% |
| Whites/Caucasians | 99.8 /100 | #78 | Exceptional 7.4% |
| Czechs | 99.8 /100 | #79 | Exceptional 7.4% |
| Alaska Natives | 99.8 /100 | #80 | Exceptional 7.3% |
| Finns | 99.8 /100 | #81 | Exceptional 7.3% |
| Northern Europeans | 99.8 /100 | #82 | Exceptional 7.3% |
| Potawatomi | 99.7 /100 | #83 | Exceptional 7.3% |
| Afghans | 99.7 /100 | #84 | Exceptional 7.3% |
| Cree | 99.7 /100 | #85 | Exceptional 7.2% |
| Immigrants | Indonesia | 99.6 /100 | #86 | Exceptional 7.2% |
| Delaware | 99.6 /100 | #87 | Exceptional 7.2% |
Demographics Similar to Immigrants from Jamaica by 4 or more Vehicles in Household
In terms of 4 or more vehicles in household, the demographic groups most similar to Immigrants from Jamaica are Soviet Union (4.4%, a difference of 0.32%), Cape Verdean (4.4%, a difference of 0.32%), Immigrants from Caribbean (4.4%, a difference of 0.60%), Immigrants from Yemen (4.5%, a difference of 1.0%), and Ecuadorian (4.5%, a difference of 1.2%).
| Demographics | Rating | Rank | 4 or more Vehicles in Household |
| Jamaicans | 0.0 /100 | #318 | Tragic 4.6% |
| Haitians | 0.0 /100 | #319 | Tragic 4.6% |
| Immigrants | Haiti | 0.0 /100 | #320 | Tragic 4.5% |
| Ecuadorians | 0.0 /100 | #321 | Tragic 4.5% |
| Immigrants | Yemen | 0.0 /100 | #322 | Tragic 4.5% |
| Immigrants | Caribbean | 0.0 /100 | #323 | Tragic 4.4% |
| Soviet Union | 0.0 /100 | #324 | Tragic 4.4% |
| Immigrants | Jamaica | 0.0 /100 | #325 | Tragic 4.4% |
| Cape Verdeans | 0.0 /100 | #326 | Tragic 4.4% |
| Senegalese | 0.0 /100 | #327 | Tragic 4.3% |
| Trinidadians and Tobagonians | 0.0 /100 | #328 | Tragic 4.3% |
| Immigrants | Senegal | 0.0 /100 | #329 | Tragic 4.2% |
| Immigrants | Ecuador | 0.0 /100 | #330 | Tragic 4.2% |
| West Indians | 0.0 /100 | #331 | Tragic 4.2% |
| Immigrants | Dominica | 0.0 /100 | #332 | Tragic 4.2% |