Japanese vs Immigrants from Jamaica College, 1 year or more
COMPARE
Japanese
Immigrants from Jamaica
College, 1 year or more
College, 1 year or more Comparison
Japanese
Immigrants from Jamaica
55.2%
COLLEGE, 1 YEAR OR MORE
0.5/ 100
METRIC RATING
254th/ 347
METRIC RANK
54.2%
COLLEGE, 1 YEAR OR MORE
0.1/ 100
METRIC RATING
278th/ 347
METRIC RANK
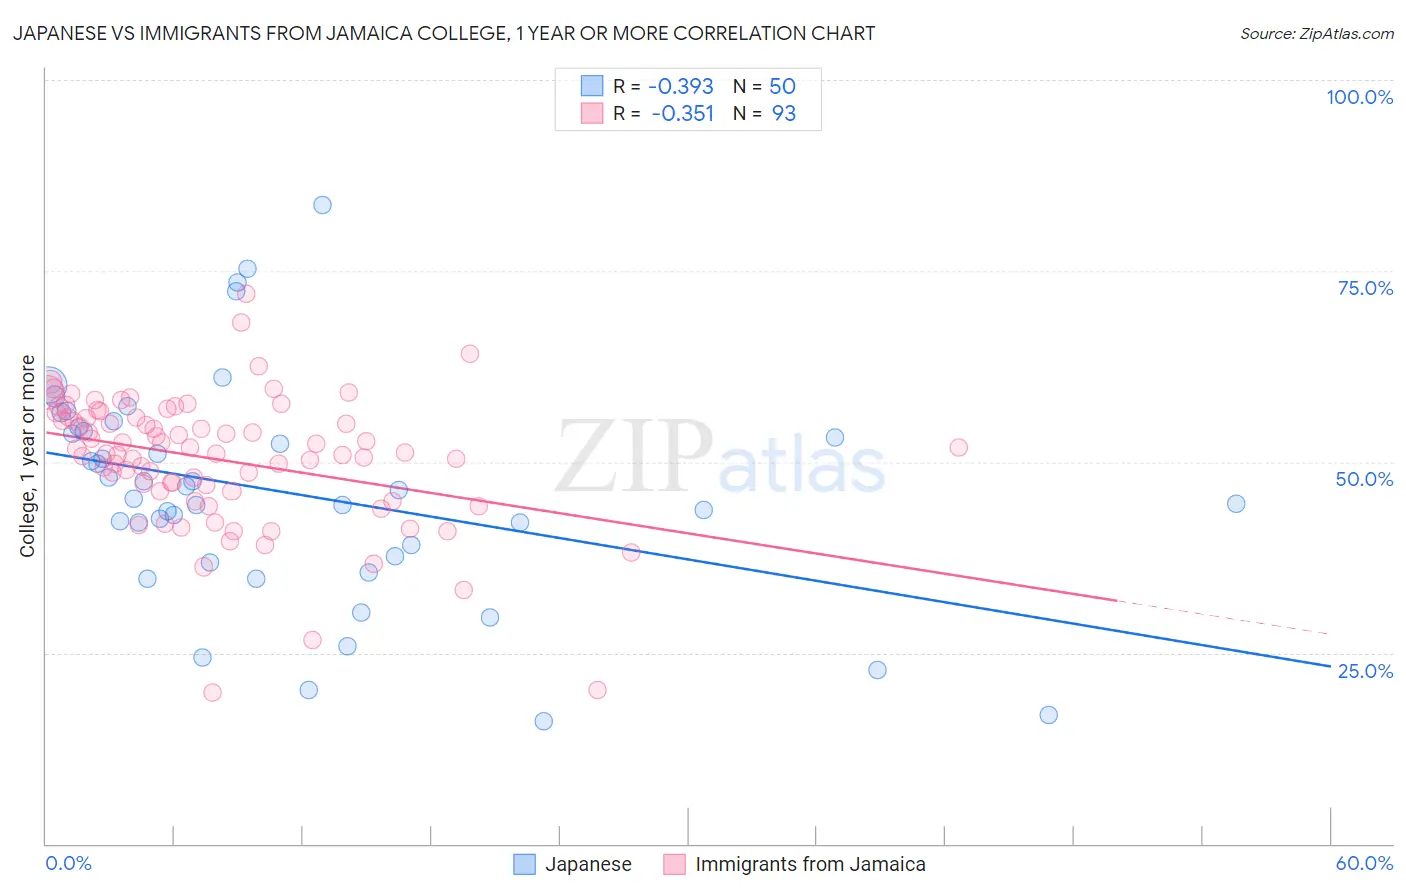
Japanese vs Immigrants from Jamaica College, 1 year or more Correlation Chart
The statistical analysis conducted on geographies consisting of 249,181,552 people shows a mild negative correlation between the proportion of Japanese and percentage of population with at least college, 1 year or more education in the United States with a correlation coefficient (R) of -0.393 and weighted average of 55.2%. Similarly, the statistical analysis conducted on geographies consisting of 301,826,812 people shows a mild negative correlation between the proportion of Immigrants from Jamaica and percentage of population with at least college, 1 year or more education in the United States with a correlation coefficient (R) of -0.351 and weighted average of 54.2%, a difference of 2.0%.
College, 1 year or more Correlation Summary
| Measurement | Japanese | Immigrants from Jamaica |
| Minimum | 16.1% | 19.8% |
| Maximum | 83.7% | 72.1% |
| Range | 67.6% | 52.3% |
| Mean | 45.9% | 50.3% |
| Median | 45.8% | 51.2% |
| Interquartile 25% (IQ1) | 37.6% | 46.2% |
| Interquartile 75% (IQ3) | 54.1% | 55.9% |
| Interquartile Range (IQR) | 16.5% | 9.7% |
| Standard Deviation (Sample) | 14.4% | 8.7% |
| Standard Deviation (Population) | 14.2% | 8.7% |
Similar Demographics by College, 1 year or more
Demographics Similar to Japanese by College, 1 year or more
In terms of college, 1 year or more, the demographic groups most similar to Japanese are Immigrants from Bahamas (55.2%, a difference of 0.050%), Immigrants from West Indies (55.2%, a difference of 0.12%), Indonesian (55.1%, a difference of 0.22%), Immigrants from Barbados (55.4%, a difference of 0.25%), and Aleut (55.4%, a difference of 0.36%).
| Demographics | Rating | Rank | College, 1 year or more |
| Hawaiians | 0.8 /100 | #247 | Tragic 55.6% |
| Immigrants | Congo | 0.8 /100 | #248 | Tragic 55.6% |
| Immigrants | Trinidad and Tobago | 0.7 /100 | #249 | Tragic 55.5% |
| Delaware | 0.7 /100 | #250 | Tragic 55.5% |
| Immigrants | Cambodia | 0.6 /100 | #251 | Tragic 55.4% |
| Aleuts | 0.6 /100 | #252 | Tragic 55.4% |
| Immigrants | Barbados | 0.6 /100 | #253 | Tragic 55.4% |
| Japanese | 0.5 /100 | #254 | Tragic 55.2% |
| Immigrants | Bahamas | 0.5 /100 | #255 | Tragic 55.2% |
| Immigrants | West Indies | 0.5 /100 | #256 | Tragic 55.2% |
| Indonesians | 0.4 /100 | #257 | Tragic 55.1% |
| Africans | 0.4 /100 | #258 | Tragic 55.0% |
| Nepalese | 0.3 /100 | #259 | Tragic 54.9% |
| Jamaicans | 0.3 /100 | #260 | Tragic 54.9% |
| Ottawa | 0.3 /100 | #261 | Tragic 54.9% |
Demographics Similar to Immigrants from Jamaica by College, 1 year or more
In terms of college, 1 year or more, the demographic groups most similar to Immigrants from Jamaica are Arapaho (54.1%, a difference of 0.020%), Cheyenne (54.1%, a difference of 0.070%), Colville (54.1%, a difference of 0.090%), Guyanese (54.1%, a difference of 0.13%), and Ecuadorian (54.3%, a difference of 0.32%).
| Demographics | Rating | Rank | College, 1 year or more |
| Bahamians | 0.2 /100 | #271 | Tragic 54.5% |
| Comanche | 0.2 /100 | #272 | Tragic 54.4% |
| Immigrants | Grenada | 0.2 /100 | #273 | Tragic 54.4% |
| Belizeans | 0.2 /100 | #274 | Tragic 54.4% |
| Americans | 0.2 /100 | #275 | Tragic 54.4% |
| Shoshone | 0.2 /100 | #276 | Tragic 54.3% |
| Ecuadorians | 0.2 /100 | #277 | Tragic 54.3% |
| Immigrants | Jamaica | 0.1 /100 | #278 | Tragic 54.2% |
| Arapaho | 0.1 /100 | #279 | Tragic 54.1% |
| Cheyenne | 0.1 /100 | #280 | Tragic 54.1% |
| Colville | 0.1 /100 | #281 | Tragic 54.1% |
| Guyanese | 0.1 /100 | #282 | Tragic 54.1% |
| Nicaraguans | 0.1 /100 | #283 | Tragic 53.9% |
| Ute | 0.1 /100 | #284 | Tragic 53.8% |
| Immigrants | Guyana | 0.1 /100 | #285 | Tragic 53.5% |