Japanese vs Immigrants from Denmark Male Disability
COMPARE
Japanese
Immigrants from Denmark
Male Disability
Male Disability Comparison
Japanese
Immigrants from Denmark
11.7%
MALE DISABILITY
3.1/ 100
METRIC RATING
224th/ 347
METRIC RANK
11.0%
MALE DISABILITY
76.4/ 100
METRIC RATING
149th/ 347
METRIC RANK
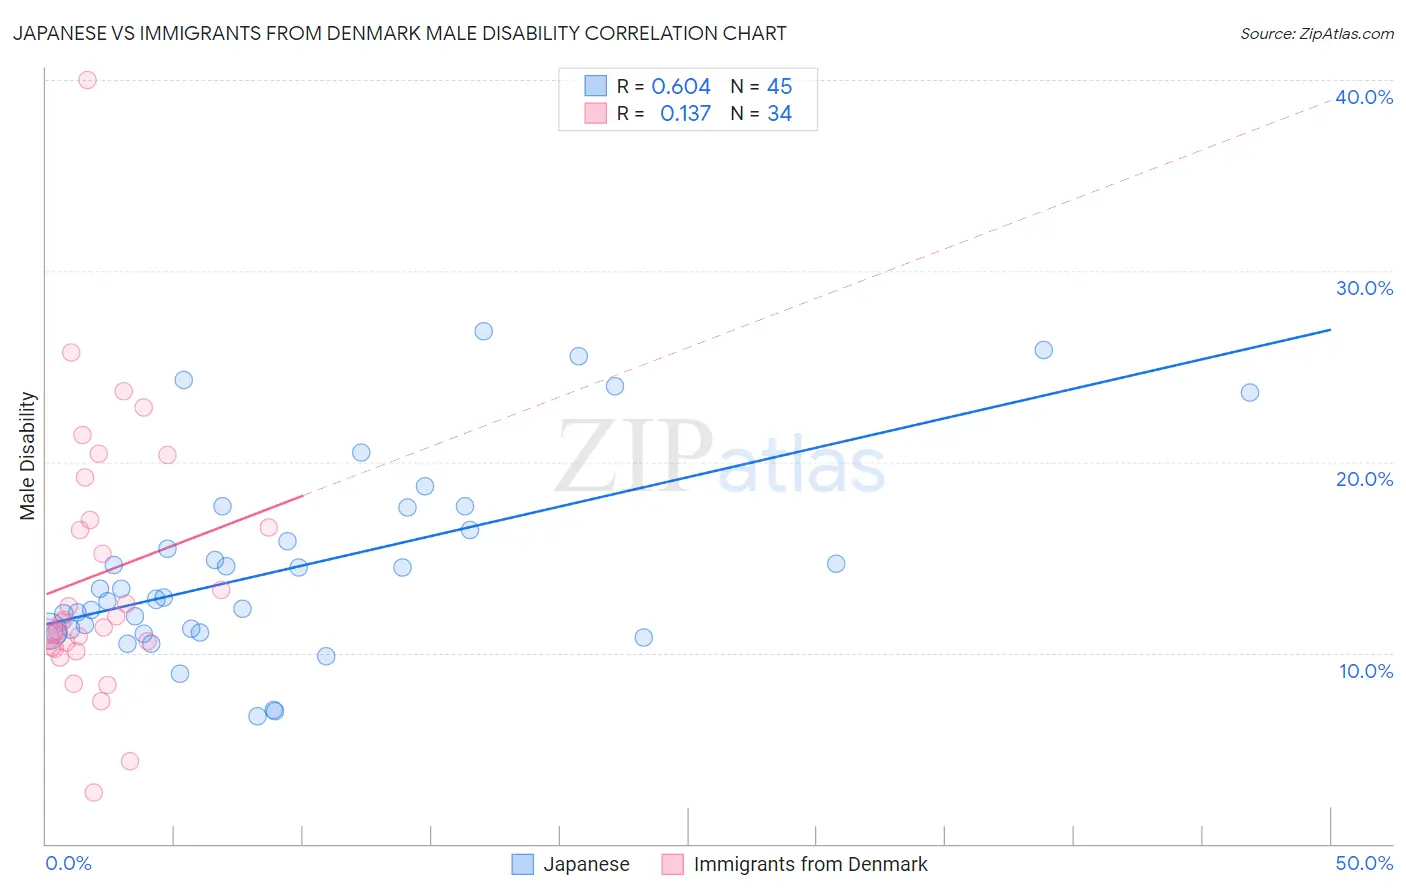
Japanese vs Immigrants from Denmark Male Disability Correlation Chart
The statistical analysis conducted on geographies consisting of 249,159,975 people shows a significant positive correlation between the proportion of Japanese and percentage of males with a disability in the United States with a correlation coefficient (R) of 0.604 and weighted average of 11.7%. Similarly, the statistical analysis conducted on geographies consisting of 136,428,328 people shows a poor positive correlation between the proportion of Immigrants from Denmark and percentage of males with a disability in the United States with a correlation coefficient (R) of 0.137 and weighted average of 11.0%, a difference of 6.5%.
Male Disability Correlation Summary
| Measurement | Japanese | Immigrants from Denmark |
| Minimum | 6.7% | 2.7% |
| Maximum | 26.9% | 40.0% |
| Range | 20.2% | 37.3% |
| Mean | 14.5% | 14.1% |
| Median | 12.9% | 11.7% |
| Interquartile 25% (IQ1) | 11.1% | 10.3% |
| Interquartile 75% (IQ3) | 17.0% | 17.0% |
| Interquartile Range (IQR) | 5.9% | 6.7% |
| Standard Deviation (Sample) | 5.1% | 7.1% |
| Standard Deviation (Population) | 5.1% | 7.0% |
Similar Demographics by Male Disability
Demographics Similar to Japanese by Male Disability
In terms of male disability, the demographic groups most similar to Japanese are Liberian (11.8%, a difference of 0.010%), Immigrants from Bahamas (11.7%, a difference of 0.020%), Alsatian (11.7%, a difference of 0.11%), Subsaharan African (11.8%, a difference of 0.13%), and Immigrants from Congo (11.7%, a difference of 0.26%).
| Demographics | Rating | Rank | Male Disability |
| Immigrants | Dominica | 4.6 /100 | #217 | Tragic 11.7% |
| Immigrants | England | 4.0 /100 | #218 | Tragic 11.7% |
| Panamanians | 3.8 /100 | #219 | Tragic 11.7% |
| Immigrants | Western Europe | 3.8 /100 | #220 | Tragic 11.7% |
| Immigrants | Congo | 3.7 /100 | #221 | Tragic 11.7% |
| Alsatians | 3.3 /100 | #222 | Tragic 11.7% |
| Immigrants | Bahamas | 3.2 /100 | #223 | Tragic 11.7% |
| Japanese | 3.1 /100 | #224 | Tragic 11.7% |
| Liberians | 3.1 /100 | #225 | Tragic 11.8% |
| Sub-Saharan Africans | 2.8 /100 | #226 | Tragic 11.8% |
| Austrians | 2.5 /100 | #227 | Tragic 11.8% |
| Hispanics or Latinos | 2.3 /100 | #228 | Tragic 11.8% |
| Bermudans | 2.3 /100 | #229 | Tragic 11.8% |
| Croatians | 2.1 /100 | #230 | Tragic 11.8% |
| Dominicans | 1.8 /100 | #231 | Tragic 11.8% |
Demographics Similar to Immigrants from Denmark by Male Disability
In terms of male disability, the demographic groups most similar to Immigrants from Denmark are Sudanese (11.0%, a difference of 0.060%), Immigrants from Croatia (11.0%, a difference of 0.070%), Korean (11.0%, a difference of 0.090%), Immigrants from Guatemala (11.0%, a difference of 0.10%), and Cuban (11.0%, a difference of 0.12%).
| Demographics | Rating | Rank | Male Disability |
| Immigrants | Sudan | 81.5 /100 | #142 | Excellent 11.0% |
| Moroccans | 80.7 /100 | #143 | Excellent 11.0% |
| Kenyans | 78.1 /100 | #144 | Good 11.0% |
| Costa Ricans | 78.0 /100 | #145 | Good 11.0% |
| Koreans | 77.5 /100 | #146 | Good 11.0% |
| Immigrants | Croatia | 77.3 /100 | #147 | Good 11.0% |
| Sudanese | 77.1 /100 | #148 | Good 11.0% |
| Immigrants | Denmark | 76.4 /100 | #149 | Good 11.0% |
| Immigrants | Guatemala | 75.1 /100 | #150 | Good 11.0% |
| Cubans | 74.9 /100 | #151 | Good 11.0% |
| Immigrants | Albania | 74.4 /100 | #152 | Good 11.0% |
| Immigrants | Northern Europe | 73.2 /100 | #153 | Good 11.1% |
| Immigrants | Moldova | 72.8 /100 | #154 | Good 11.1% |
| Immigrants | Middle Africa | 70.9 /100 | #155 | Good 11.1% |
| Russians | 69.8 /100 | #156 | Good 11.1% |