Japanese vs Immigrants from Denmark Female Unemployment
COMPARE
Japanese
Immigrants from Denmark
Female Unemployment
Female Unemployment Comparison
Japanese
Immigrants from Denmark
5.6%
FEMALE UNEMPLOYMENT
1.2/ 100
METRIC RATING
246th/ 347
METRIC RANK
5.2%
FEMALE UNEMPLOYMENT
55.0/ 100
METRIC RATING
171st/ 347
METRIC RANK
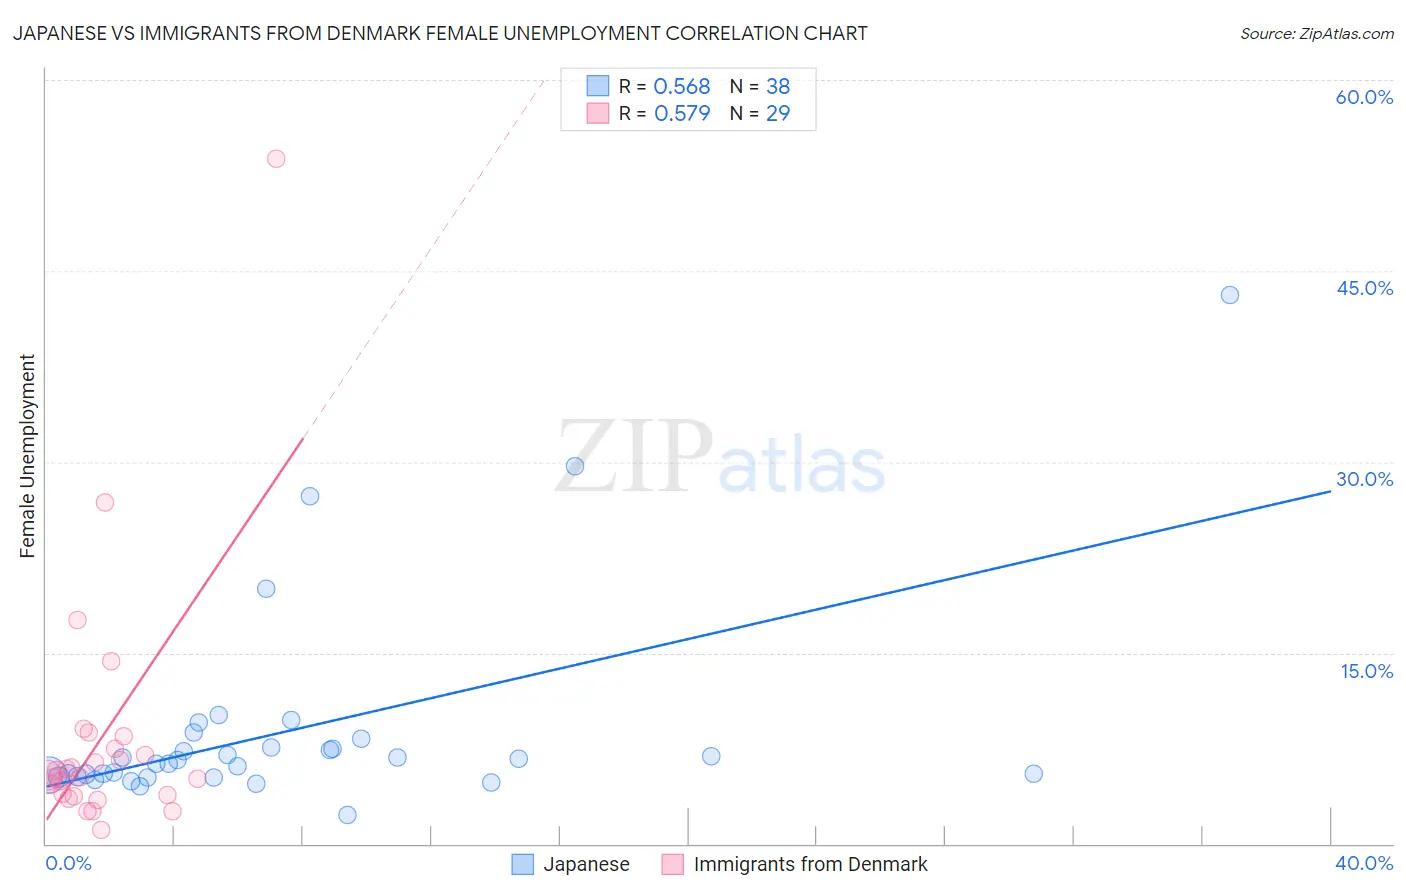
Japanese vs Immigrants from Denmark Female Unemployment Correlation Chart
The statistical analysis conducted on geographies consisting of 248,709,306 people shows a substantial positive correlation between the proportion of Japanese and unemploymnet rate among females in the United States with a correlation coefficient (R) of 0.568 and weighted average of 5.6%. Similarly, the statistical analysis conducted on geographies consisting of 136,180,001 people shows a substantial positive correlation between the proportion of Immigrants from Denmark and unemploymnet rate among females in the United States with a correlation coefficient (R) of 0.579 and weighted average of 5.2%, a difference of 7.0%.
Female Unemployment Correlation Summary
| Measurement | Japanese | Immigrants from Denmark |
| Minimum | 2.3% | 1.1% |
| Maximum | 43.1% | 53.8% |
| Range | 40.8% | 52.7% |
| Mean | 8.8% | 8.3% |
| Median | 6.4% | 5.4% |
| Interquartile 25% (IQ1) | 5.3% | 3.8% |
| Interquartile 75% (IQ3) | 7.5% | 8.0% |
| Interquartile Range (IQR) | 2.3% | 4.2% |
| Standard Deviation (Sample) | 8.0% | 10.1% |
| Standard Deviation (Population) | 7.9% | 10.0% |
Similar Demographics by Female Unemployment
Demographics Similar to Japanese by Female Unemployment
In terms of female unemployment, the demographic groups most similar to Japanese are Immigrants from Western Asia (5.6%, a difference of 0.080%), Guamanian/Chamorro (5.6%, a difference of 0.23%), Cree (5.6%, a difference of 0.24%), Immigrants from Uzbekistan (5.6%, a difference of 0.28%), and Immigrants from Liberia (5.6%, a difference of 0.37%).
| Demographics | Rating | Rank | Female Unemployment |
| Aleuts | 3.0 /100 | #239 | Tragic 5.5% |
| Immigrants | South America | 2.9 /100 | #240 | Tragic 5.5% |
| South American Indians | 2.8 /100 | #241 | Tragic 5.5% |
| Marshallese | 2.3 /100 | #242 | Tragic 5.6% |
| Spanish Americans | 2.2 /100 | #243 | Tragic 5.6% |
| Immigrants | Liberia | 1.5 /100 | #244 | Tragic 5.6% |
| Guamanians/Chamorros | 1.4 /100 | #245 | Tragic 5.6% |
| Japanese | 1.2 /100 | #246 | Tragic 5.6% |
| Immigrants | Western Asia | 1.1 /100 | #247 | Tragic 5.6% |
| Cree | 1.0 /100 | #248 | Tragic 5.6% |
| Immigrants | Uzbekistan | 1.0 /100 | #249 | Tragic 5.6% |
| Immigrants | Syria | 0.8 /100 | #250 | Tragic 5.6% |
| Assyrians/Chaldeans/Syriacs | 0.8 /100 | #251 | Tragic 5.6% |
| Cajuns | 0.7 /100 | #252 | Tragic 5.7% |
| Immigrants | Sierra Leone | 0.6 /100 | #253 | Tragic 5.7% |
Demographics Similar to Immigrants from Denmark by Female Unemployment
In terms of female unemployment, the demographic groups most similar to Immigrants from Denmark are Spanish (5.2%, a difference of 0.050%), Immigrants from Chile (5.2%, a difference of 0.24%), Immigrants from Uganda (5.3%, a difference of 0.26%), Sri Lankan (5.2%, a difference of 0.27%), and Iranian (5.3%, a difference of 0.28%).
| Demographics | Rating | Rank | Female Unemployment |
| Bangladeshis | 64.3 /100 | #164 | Good 5.2% |
| Syrians | 62.8 /100 | #165 | Good 5.2% |
| Native Hawaiians | 62.7 /100 | #166 | Good 5.2% |
| Immigrants | Thailand | 62.1 /100 | #167 | Good 5.2% |
| Sri Lankans | 59.4 /100 | #168 | Average 5.2% |
| Immigrants | Chile | 59.0 /100 | #169 | Average 5.2% |
| Spanish | 55.9 /100 | #170 | Average 5.2% |
| Immigrants | Denmark | 55.0 /100 | #171 | Average 5.2% |
| Immigrants | Uganda | 50.7 /100 | #172 | Average 5.3% |
| Iranians | 50.4 /100 | #173 | Average 5.3% |
| Immigrants | Poland | 50.0 /100 | #174 | Average 5.3% |
| Immigrants | Laos | 47.5 /100 | #175 | Average 5.3% |
| Immigrants | Vietnam | 47.5 /100 | #176 | Average 5.3% |
| Immigrants | Morocco | 47.4 /100 | #177 | Average 5.3% |
| Immigrants | Southern Europe | 46.2 /100 | #178 | Average 5.3% |