Japanese vs Immigrants from Denmark 9th Grade
COMPARE
Japanese
Immigrants from Denmark
9th Grade
9th Grade Comparison
Japanese
Immigrants from Denmark
92.6%
9TH GRADE
0.0/ 100
METRIC RATING
305th/ 347
METRIC RANK
95.7%
9TH GRADE
99.1/ 100
METRIC RATING
84th/ 347
METRIC RANK
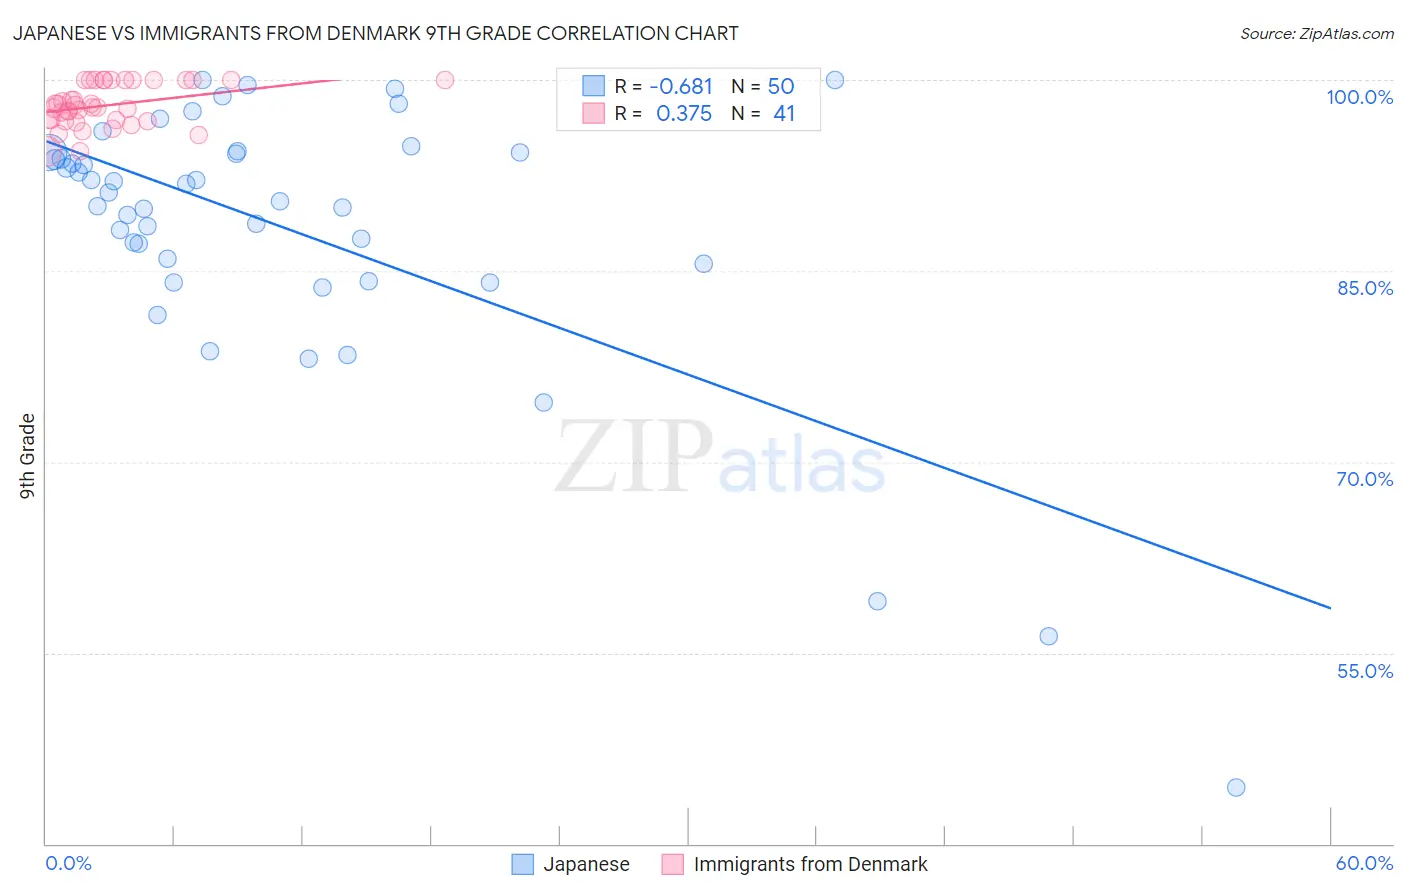
Japanese vs Immigrants from Denmark 9th Grade Correlation Chart
The statistical analysis conducted on geographies consisting of 249,183,224 people shows a significant negative correlation between the proportion of Japanese and percentage of population with at least 9th grade education in the United States with a correlation coefficient (R) of -0.681 and weighted average of 92.6%. Similarly, the statistical analysis conducted on geographies consisting of 136,430,932 people shows a mild positive correlation between the proportion of Immigrants from Denmark and percentage of population with at least 9th grade education in the United States with a correlation coefficient (R) of 0.375 and weighted average of 95.7%, a difference of 3.3%.
9th Grade Correlation Summary
| Measurement | Japanese | Immigrants from Denmark |
| Minimum | 44.4% | 94.4% |
| Maximum | 100.0% | 100.0% |
| Range | 55.6% | 5.6% |
| Mean | 88.3% | 98.0% |
| Median | 90.8% | 97.8% |
| Interquartile 25% (IQ1) | 85.6% | 96.8% |
| Interquartile 75% (IQ3) | 94.3% | 100.0% |
| Interquartile Range (IQR) | 8.7% | 3.2% |
| Standard Deviation (Sample) | 10.9% | 1.6% |
| Standard Deviation (Population) | 10.8% | 1.6% |
Similar Demographics by 9th Grade
Demographics Similar to Japanese by 9th Grade
In terms of 9th grade, the demographic groups most similar to Japanese are Immigrants from Vietnam (92.6%, a difference of 0.0%), Tohono O'odham (92.6%, a difference of 0.020%), Guyanese (92.7%, a difference of 0.040%), Immigrants from Dominica (92.7%, a difference of 0.060%), and Immigrants (92.5%, a difference of 0.10%).
| Demographics | Rating | Rank | 9th Grade |
| Haitians | 0.0 /100 | #298 | Tragic 93.1% |
| Immigrants | Grenada | 0.0 /100 | #299 | Tragic 93.0% |
| Yaqui | 0.0 /100 | #300 | Tragic 92.9% |
| Immigrants | Haiti | 0.0 /100 | #301 | Tragic 92.7% |
| Immigrants | Dominica | 0.0 /100 | #302 | Tragic 92.7% |
| Guyanese | 0.0 /100 | #303 | Tragic 92.7% |
| Tohono O'odham | 0.0 /100 | #304 | Tragic 92.6% |
| Japanese | 0.0 /100 | #305 | Tragic 92.6% |
| Immigrants | Vietnam | 0.0 /100 | #306 | Tragic 92.6% |
| Immigrants | Immigrants | 0.0 /100 | #307 | Tragic 92.5% |
| Immigrants | Guyana | 0.0 /100 | #308 | Tragic 92.5% |
| Immigrants | Bangladesh | 0.0 /100 | #309 | Tragic 92.4% |
| Immigrants | Cambodia | 0.0 /100 | #310 | Tragic 92.4% |
| Immigrants | Fiji | 0.0 /100 | #311 | Tragic 92.3% |
| Houma | 0.0 /100 | #312 | Tragic 92.3% |
Demographics Similar to Immigrants from Denmark by 9th Grade
In terms of 9th grade, the demographic groups most similar to Immigrants from Denmark are Icelander (95.7%, a difference of 0.0%), Immigrants from Western Europe (95.7%, a difference of 0.0%), Swiss (95.7%, a difference of 0.010%), Puget Sound Salish (95.7%, a difference of 0.020%), and Bhutanese (95.7%, a difference of 0.030%).
| Demographics | Rating | Rank | 9th Grade |
| Whites/Caucasians | 99.4 /100 | #77 | Exceptional 95.8% |
| Immigrants | South Africa | 99.4 /100 | #78 | Exceptional 95.8% |
| Romanians | 99.3 /100 | #79 | Exceptional 95.7% |
| Bhutanese | 99.3 /100 | #80 | Exceptional 95.7% |
| Arapaho | 99.3 /100 | #81 | Exceptional 95.7% |
| Puget Sound Salish | 99.2 /100 | #82 | Exceptional 95.7% |
| Swiss | 99.2 /100 | #83 | Exceptional 95.7% |
| Immigrants | Denmark | 99.1 /100 | #84 | Exceptional 95.7% |
| Icelanders | 99.1 /100 | #85 | Exceptional 95.7% |
| Immigrants | Western Europe | 99.1 /100 | #86 | Exceptional 95.7% |
| Okinawans | 99.0 /100 | #87 | Exceptional 95.7% |
| Immigrants | Czechoslovakia | 98.9 /100 | #88 | Exceptional 95.7% |
| Yugoslavians | 98.9 /100 | #89 | Exceptional 95.7% |
| South Africans | 98.8 /100 | #90 | Exceptional 95.6% |
| Creek | 98.8 /100 | #91 | Exceptional 95.6% |