Immigrants from Southern Europe vs Immigrants from China 2 or more Vehicles in Household
COMPARE
Immigrants from Southern Europe
Immigrants from China
2 or more Vehicles in Household
2 or more Vehicles in Household Comparison
Immigrants from Southern Europe
Immigrants from China
52.3%
2 OR MORE VEHICLES IN HOUSEHOLD
0.4/ 100
METRIC RATING
263rd/ 347
METRIC RANK
51.5%
2 OR MORE VEHICLES IN HOUSEHOLD
0.1/ 100
METRIC RATING
283rd/ 347
METRIC RANK
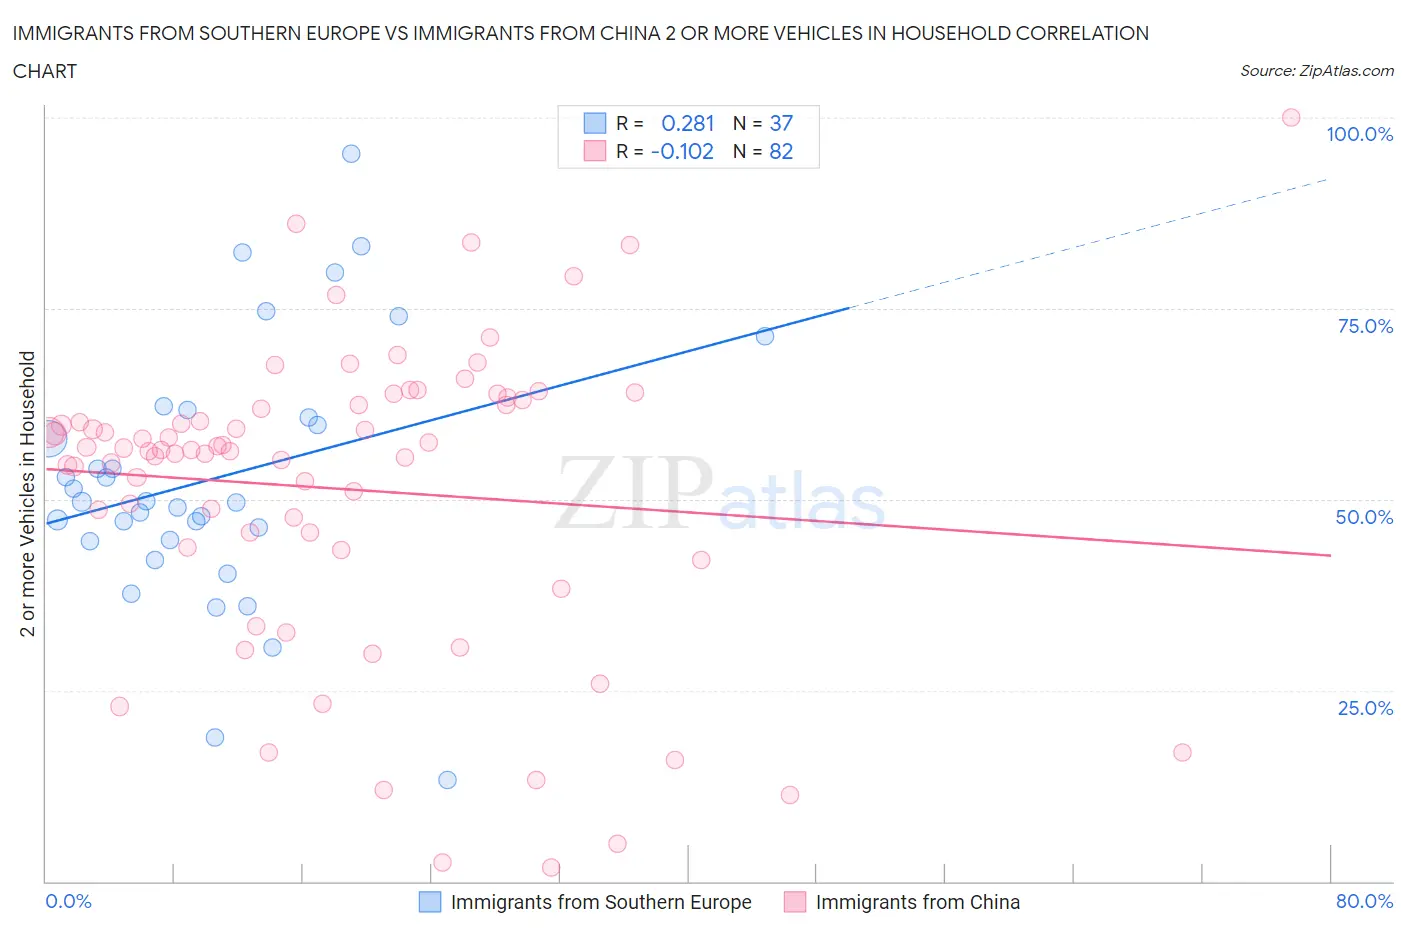
Immigrants from Southern Europe vs Immigrants from China 2 or more Vehicles in Household Correlation Chart
The statistical analysis conducted on geographies consisting of 402,657,481 people shows a weak positive correlation between the proportion of Immigrants from Southern Europe and percentage of households with 2 or more vehicles available in the United States with a correlation coefficient (R) of 0.281 and weighted average of 52.3%. Similarly, the statistical analysis conducted on geographies consisting of 456,653,967 people shows a poor negative correlation between the proportion of Immigrants from China and percentage of households with 2 or more vehicles available in the United States with a correlation coefficient (R) of -0.102 and weighted average of 51.5%, a difference of 1.5%.
2 or more Vehicles in Household Correlation Summary
| Measurement | Immigrants from Southern Europe | Immigrants from China |
| Minimum | 13.2% | 1.8% |
| Maximum | 95.2% | 100.0% |
| Range | 82.0% | 98.2% |
| Mean | 52.8% | 51.4% |
| Median | 49.7% | 56.4% |
| Interquartile 25% (IQ1) | 44.6% | 43.8% |
| Interquartile 75% (IQ3) | 61.2% | 62.3% |
| Interquartile Range (IQR) | 16.6% | 18.6% |
| Standard Deviation (Sample) | 17.1% | 19.7% |
| Standard Deviation (Population) | 16.9% | 19.6% |
Demographics Similar to Immigrants from Southern Europe and Immigrants from China by 2 or more Vehicles in Household
In terms of 2 or more vehicles in household, the demographic groups most similar to Immigrants from Southern Europe are Immigrants from Latvia (52.2%, a difference of 0.040%), Immigrants from Congo (52.1%, a difference of 0.28%), Immigrants from France (52.0%, a difference of 0.42%), Immigrants from Colombia (52.0%, a difference of 0.47%), and Pima (52.0%, a difference of 0.48%). Similarly, the demographic groups most similar to Immigrants from China are Bahamian (51.5%, a difference of 0.080%), Immigrants from Kazakhstan (51.6%, a difference of 0.14%), Immigrants from Eastern Europe (51.7%, a difference of 0.45%), Yuman (51.7%, a difference of 0.49%), and Liberian (51.7%, a difference of 0.49%).
| Demographics | Rating | Rank | 2 or more Vehicles in Household |
| Immigrants | Southern Europe | 0.4 /100 | #263 | Tragic 52.3% |
| Immigrants | Latvia | 0.4 /100 | #264 | Tragic 52.2% |
| Immigrants | Congo | 0.3 /100 | #265 | Tragic 52.1% |
| Immigrants | France | 0.2 /100 | #266 | Tragic 52.0% |
| Immigrants | Colombia | 0.2 /100 | #267 | Tragic 52.0% |
| Pima | 0.2 /100 | #268 | Tragic 52.0% |
| Hondurans | 0.2 /100 | #269 | Tragic 52.0% |
| Immigrants | Ireland | 0.2 /100 | #270 | Tragic 52.0% |
| South Americans | 0.2 /100 | #271 | Tragic 51.9% |
| Sub-Saharan Africans | 0.2 /100 | #272 | Tragic 51.9% |
| Israelis | 0.2 /100 | #273 | Tragic 51.9% |
| Africans | 0.2 /100 | #274 | Tragic 51.8% |
| Immigrants | Honduras | 0.2 /100 | #275 | Tragic 51.8% |
| Immigrants | Croatia | 0.2 /100 | #276 | Tragic 51.8% |
| Immigrants | Africa | 0.2 /100 | #277 | Tragic 51.8% |
| Yuman | 0.1 /100 | #278 | Tragic 51.7% |
| Liberians | 0.1 /100 | #279 | Tragic 51.7% |
| Immigrants | Eastern Europe | 0.1 /100 | #280 | Tragic 51.7% |
| Immigrants | Kazakhstan | 0.1 /100 | #281 | Tragic 51.6% |
| Bahamians | 0.1 /100 | #282 | Tragic 51.5% |
| Immigrants | China | 0.1 /100 | #283 | Tragic 51.5% |