Jamaican vs Immigrants from the Azores 2 or more Vehicles in Household
COMPARE
Jamaican
Immigrants from the Azores
2 or more Vehicles in Household
2 or more Vehicles in Household Comparison
Jamaicans
Immigrants from the Azores
45.8%
2 OR MORE VEHICLES IN HOUSEHOLD
0.0/ 100
METRIC RATING
319th/ 347
METRIC RANK
56.4%
2 OR MORE VEHICLES IN HOUSEHOLD
86.6/ 100
METRIC RATING
134th/ 347
METRIC RANK
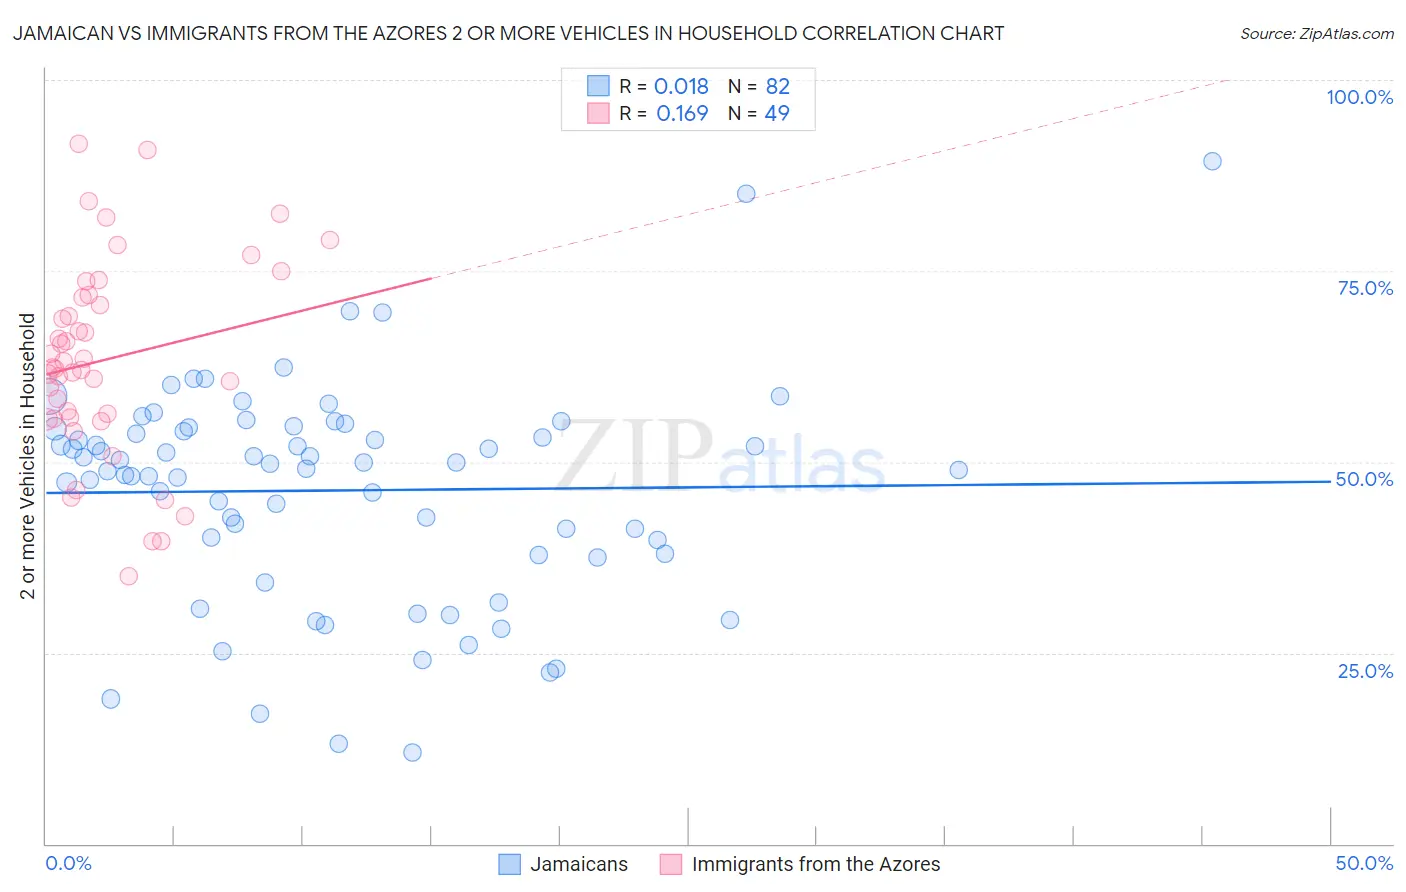
Jamaican vs Immigrants from the Azores 2 or more Vehicles in Household Correlation Chart
The statistical analysis conducted on geographies consisting of 367,700,586 people shows no correlation between the proportion of Jamaicans and percentage of households with 2 or more vehicles available in the United States with a correlation coefficient (R) of 0.018 and weighted average of 45.8%. Similarly, the statistical analysis conducted on geographies consisting of 46,257,310 people shows a poor positive correlation between the proportion of Immigrants from the Azores and percentage of households with 2 or more vehicles available in the United States with a correlation coefficient (R) of 0.169 and weighted average of 56.4%, a difference of 23.2%.
2 or more Vehicles in Household Correlation Summary
| Measurement | Jamaican | Immigrants from the Azores |
| Minimum | 12.0% | 35.0% |
| Maximum | 89.3% | 91.6% |
| Range | 77.3% | 56.6% |
| Mean | 46.3% | 63.4% |
| Median | 49.4% | 62.3% |
| Interquartile 25% (IQ1) | 38.0% | 55.7% |
| Interquartile 75% (IQ3) | 54.3% | 71.7% |
| Interquartile Range (IQR) | 16.3% | 15.9% |
| Standard Deviation (Sample) | 14.2% | 12.9% |
| Standard Deviation (Population) | 14.1% | 12.7% |
Similar Demographics by 2 or more Vehicles in Household
Demographics Similar to Jamaicans by 2 or more Vehicles in Household
In terms of 2 or more vehicles in household, the demographic groups most similar to Jamaicans are Soviet Union (45.7%, a difference of 0.060%), Immigrants from Albania (46.0%, a difference of 0.52%), Immigrants from Haiti (46.5%, a difference of 1.7%), Cape Verdean (46.8%, a difference of 2.2%), and Puerto Rican (47.1%, a difference of 2.9%).
| Demographics | Rating | Rank | 2 or more Vehicles in Household |
| Haitians | 0.0 /100 | #312 | Tragic 47.6% |
| U.S. Virgin Islanders | 0.0 /100 | #313 | Tragic 47.5% |
| Immigrants | Ghana | 0.0 /100 | #314 | Tragic 47.4% |
| Puerto Ricans | 0.0 /100 | #315 | Tragic 47.1% |
| Cape Verdeans | 0.0 /100 | #316 | Tragic 46.8% |
| Immigrants | Haiti | 0.0 /100 | #317 | Tragic 46.5% |
| Immigrants | Albania | 0.0 /100 | #318 | Tragic 46.0% |
| Jamaicans | 0.0 /100 | #319 | Tragic 45.8% |
| Soviet Union | 0.0 /100 | #320 | Tragic 45.7% |
| Immigrants | Jamaica | 0.0 /100 | #321 | Tragic 44.5% |
| Senegalese | 0.0 /100 | #322 | Tragic 44.2% |
| Immigrants | Caribbean | 0.0 /100 | #323 | Tragic 44.2% |
| Immigrants | Cabo Verde | 0.0 /100 | #324 | Tragic 43.3% |
| Immigrants | West Indies | 0.0 /100 | #325 | Tragic 43.1% |
| Immigrants | Senegal | 0.0 /100 | #326 | Tragic 43.0% |
Demographics Similar to Immigrants from the Azores by 2 or more Vehicles in Household
In terms of 2 or more vehicles in household, the demographic groups most similar to Immigrants from the Azores are Blackfeet (56.4%, a difference of 0.010%), Immigrants from Asia (56.3%, a difference of 0.050%), Cuban (56.3%, a difference of 0.14%), Salvadoran (56.3%, a difference of 0.15%), and Comanche (56.5%, a difference of 0.16%).
| Demographics | Rating | Rank | 2 or more Vehicles in Household |
| Immigrants | Thailand | 90.7 /100 | #127 | Exceptional 56.6% |
| Immigrants | South Central Asia | 90.5 /100 | #128 | Exceptional 56.6% |
| Ute | 90.4 /100 | #129 | Exceptional 56.6% |
| Yugoslavians | 90.0 /100 | #130 | Exceptional 56.6% |
| Bulgarians | 89.7 /100 | #131 | Excellent 56.5% |
| Hungarians | 89.1 /100 | #132 | Excellent 56.5% |
| Comanche | 88.4 /100 | #133 | Excellent 56.5% |
| Immigrants | Azores | 86.6 /100 | #134 | Excellent 56.4% |
| Blackfeet | 86.5 /100 | #135 | Excellent 56.4% |
| Immigrants | Asia | 86.0 /100 | #136 | Excellent 56.3% |
| Cubans | 84.8 /100 | #137 | Excellent 56.3% |
| Salvadorans | 84.7 /100 | #138 | Excellent 56.3% |
| Armenians | 84.3 /100 | #139 | Excellent 56.3% |
| Latvians | 83.6 /100 | #140 | Excellent 56.2% |
| Immigrants | Cambodia | 83.6 /100 | #141 | Excellent 56.2% |