Jamaican vs Sudanese 2 or more Vehicles in Household
COMPARE
Jamaican
Sudanese
2 or more Vehicles in Household
2 or more Vehicles in Household Comparison
Jamaicans
Sudanese
45.8%
2 OR MORE VEHICLES IN HOUSEHOLD
0.0/ 100
METRIC RATING
319th/ 347
METRIC RANK
53.6%
2 OR MORE VEHICLES IN HOUSEHOLD
4.1/ 100
METRIC RATING
227th/ 347
METRIC RANK
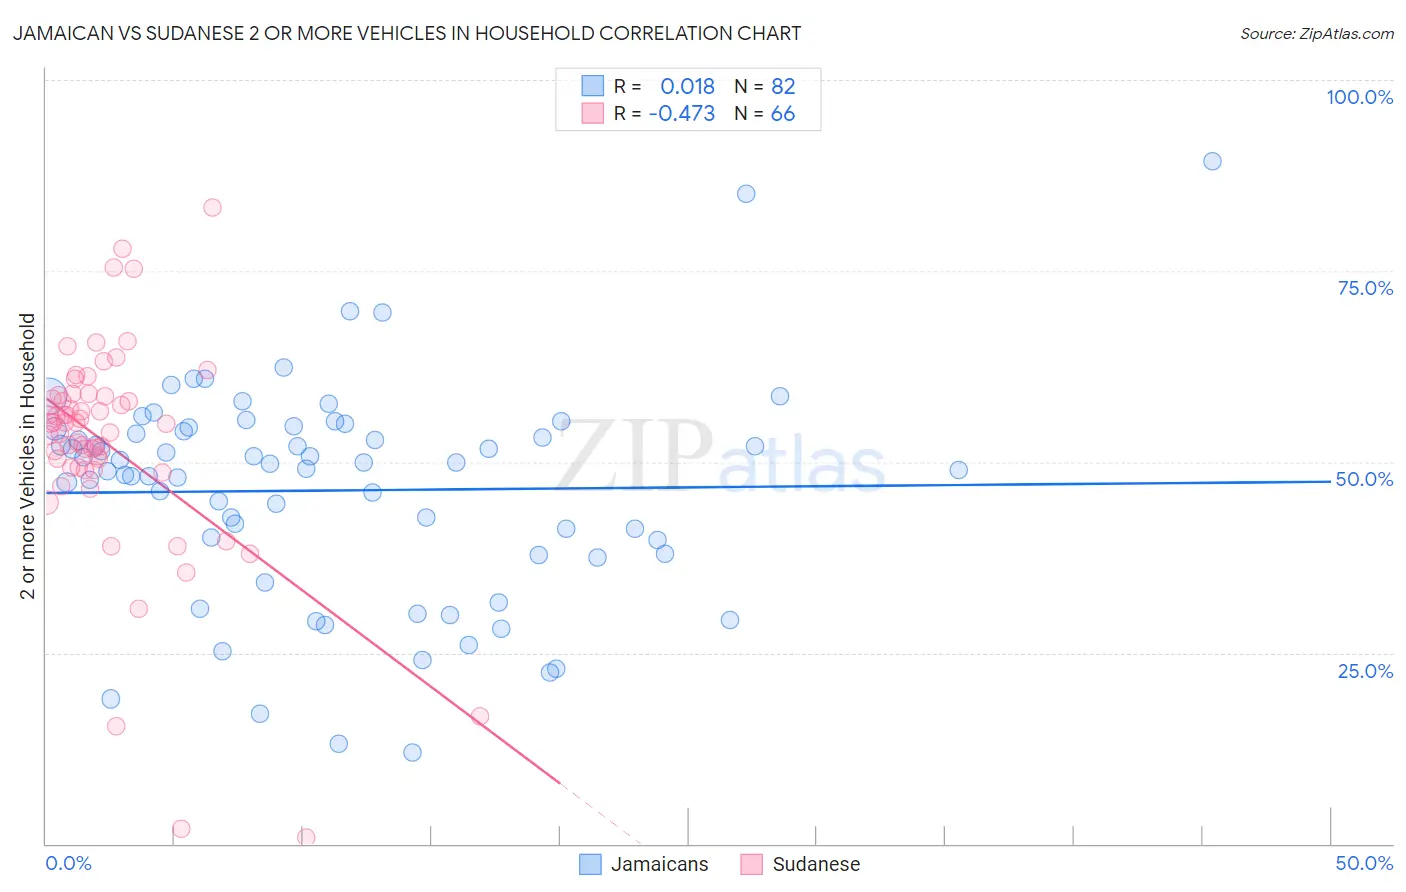
Jamaican vs Sudanese 2 or more Vehicles in Household Correlation Chart
The statistical analysis conducted on geographies consisting of 367,700,586 people shows no correlation between the proportion of Jamaicans and percentage of households with 2 or more vehicles available in the United States with a correlation coefficient (R) of 0.018 and weighted average of 45.8%. Similarly, the statistical analysis conducted on geographies consisting of 110,122,172 people shows a moderate negative correlation between the proportion of Sudanese and percentage of households with 2 or more vehicles available in the United States with a correlation coefficient (R) of -0.473 and weighted average of 53.6%, a difference of 17.1%.
2 or more Vehicles in Household Correlation Summary
| Measurement | Jamaican | Sudanese |
| Minimum | 12.0% | 0.83% |
| Maximum | 89.3% | 83.4% |
| Range | 77.3% | 82.5% |
| Mean | 46.3% | 52.1% |
| Median | 49.4% | 55.1% |
| Interquartile 25% (IQ1) | 38.0% | 49.2% |
| Interquartile 75% (IQ3) | 54.3% | 58.6% |
| Interquartile Range (IQR) | 16.3% | 9.4% |
| Standard Deviation (Sample) | 14.2% | 14.5% |
| Standard Deviation (Population) | 14.1% | 14.4% |
Similar Demographics by 2 or more Vehicles in Household
Demographics Similar to Jamaicans by 2 or more Vehicles in Household
In terms of 2 or more vehicles in household, the demographic groups most similar to Jamaicans are Soviet Union (45.7%, a difference of 0.060%), Immigrants from Albania (46.0%, a difference of 0.52%), Immigrants from Haiti (46.5%, a difference of 1.7%), Cape Verdean (46.8%, a difference of 2.2%), and Puerto Rican (47.1%, a difference of 2.9%).
| Demographics | Rating | Rank | 2 or more Vehicles in Household |
| Haitians | 0.0 /100 | #312 | Tragic 47.6% |
| U.S. Virgin Islanders | 0.0 /100 | #313 | Tragic 47.5% |
| Immigrants | Ghana | 0.0 /100 | #314 | Tragic 47.4% |
| Puerto Ricans | 0.0 /100 | #315 | Tragic 47.1% |
| Cape Verdeans | 0.0 /100 | #316 | Tragic 46.8% |
| Immigrants | Haiti | 0.0 /100 | #317 | Tragic 46.5% |
| Immigrants | Albania | 0.0 /100 | #318 | Tragic 46.0% |
| Jamaicans | 0.0 /100 | #319 | Tragic 45.8% |
| Soviet Union | 0.0 /100 | #320 | Tragic 45.7% |
| Immigrants | Jamaica | 0.0 /100 | #321 | Tragic 44.5% |
| Senegalese | 0.0 /100 | #322 | Tragic 44.2% |
| Immigrants | Caribbean | 0.0 /100 | #323 | Tragic 44.2% |
| Immigrants | Cabo Verde | 0.0 /100 | #324 | Tragic 43.3% |
| Immigrants | West Indies | 0.0 /100 | #325 | Tragic 43.1% |
| Immigrants | Senegal | 0.0 /100 | #326 | Tragic 43.0% |
Demographics Similar to Sudanese by 2 or more Vehicles in Household
In terms of 2 or more vehicles in household, the demographic groups most similar to Sudanese are Alaska Native (53.6%, a difference of 0.060%), Immigrants from Turkey (53.6%, a difference of 0.080%), Immigrants from Nepal (53.5%, a difference of 0.14%), Panamanian (53.5%, a difference of 0.19%), and Immigrants from Eastern Africa (53.7%, a difference of 0.24%).
| Demographics | Rating | Rank | 2 or more Vehicles in Household |
| Taiwanese | 6.3 /100 | #220 | Tragic 53.9% |
| Immigrants | Singapore | 6.3 /100 | #221 | Tragic 53.9% |
| Kiowa | 6.2 /100 | #222 | Tragic 53.9% |
| Immigrants | Bosnia and Herzegovina | 5.5 /100 | #223 | Tragic 53.8% |
| Brazilians | 5.3 /100 | #224 | Tragic 53.8% |
| Immigrants | Egypt | 5.2 /100 | #225 | Tragic 53.8% |
| Immigrants | Eastern Africa | 5.1 /100 | #226 | Tragic 53.7% |
| Sudanese | 4.1 /100 | #227 | Tragic 53.6% |
| Alaska Natives | 3.9 /100 | #228 | Tragic 53.6% |
| Immigrants | Turkey | 3.8 /100 | #229 | Tragic 53.6% |
| Immigrants | Nepal | 3.6 /100 | #230 | Tragic 53.5% |
| Panamanians | 3.4 /100 | #231 | Tragic 53.5% |
| Immigrants | Guatemala | 3.2 /100 | #232 | Tragic 53.5% |
| Ugandans | 3.2 /100 | #233 | Tragic 53.5% |
| Immigrants | Switzerland | 3.0 /100 | #234 | Tragic 53.4% |