Israeli vs Lithuanian 2 or more Vehicles in Household
COMPARE
Israeli
Lithuanian
2 or more Vehicles in Household
2 or more Vehicles in Household Comparison
Israelis
Lithuanians
51.9%
2 OR MORE VEHICLES IN HOUSEHOLD
0.2/ 100
METRIC RATING
273rd/ 347
METRIC RANK
58.2%
2 OR MORE VEHICLES IN HOUSEHOLD
99.5/ 100
METRIC RATING
78th/ 347
METRIC RANK
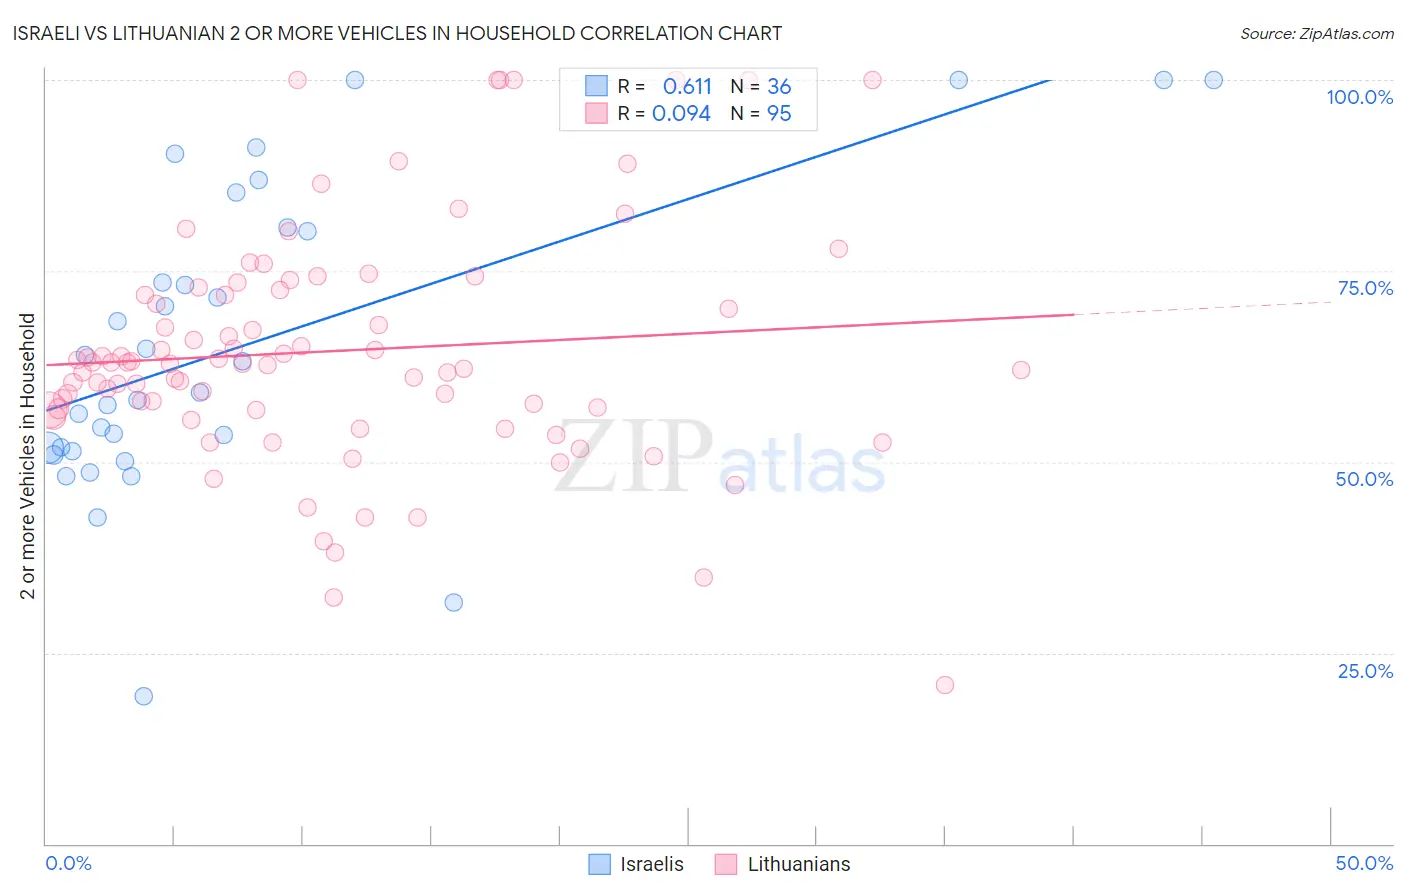
Israeli vs Lithuanian 2 or more Vehicles in Household Correlation Chart
The statistical analysis conducted on geographies consisting of 211,040,574 people shows a significant positive correlation between the proportion of Israelis and percentage of households with 2 or more vehicles available in the United States with a correlation coefficient (R) of 0.611 and weighted average of 51.9%. Similarly, the statistical analysis conducted on geographies consisting of 421,771,699 people shows a slight positive correlation between the proportion of Lithuanians and percentage of households with 2 or more vehicles available in the United States with a correlation coefficient (R) of 0.094 and weighted average of 58.2%, a difference of 12.3%.
2 or more Vehicles in Household Correlation Summary
| Measurement | Israeli | Lithuanian |
| Minimum | 19.3% | 20.9% |
| Maximum | 100.0% | 100.0% |
| Range | 80.7% | 79.1% |
| Mean | 65.3% | 64.5% |
| Median | 61.1% | 62.8% |
| Interquartile 25% (IQ1) | 51.6% | 56.8% |
| Interquartile 75% (IQ3) | 80.4% | 72.5% |
| Interquartile Range (IQR) | 28.8% | 15.7% |
| Standard Deviation (Sample) | 19.9% | 15.4% |
| Standard Deviation (Population) | 19.6% | 15.4% |
Similar Demographics by 2 or more Vehicles in Household
Demographics Similar to Israelis by 2 or more Vehicles in Household
In terms of 2 or more vehicles in household, the demographic groups most similar to Israelis are African (51.8%, a difference of 0.050%), Immigrants from Honduras (51.8%, a difference of 0.060%), Subsaharan African (51.9%, a difference of 0.090%), Immigrants from Croatia (51.8%, a difference of 0.090%), and South American (51.9%, a difference of 0.12%).
| Demographics | Rating | Rank | 2 or more Vehicles in Household |
| Immigrants | France | 0.2 /100 | #266 | Tragic 52.0% |
| Immigrants | Colombia | 0.2 /100 | #267 | Tragic 52.0% |
| Pima | 0.2 /100 | #268 | Tragic 52.0% |
| Hondurans | 0.2 /100 | #269 | Tragic 52.0% |
| Immigrants | Ireland | 0.2 /100 | #270 | Tragic 52.0% |
| South Americans | 0.2 /100 | #271 | Tragic 51.9% |
| Sub-Saharan Africans | 0.2 /100 | #272 | Tragic 51.9% |
| Israelis | 0.2 /100 | #273 | Tragic 51.9% |
| Africans | 0.2 /100 | #274 | Tragic 51.8% |
| Immigrants | Honduras | 0.2 /100 | #275 | Tragic 51.8% |
| Immigrants | Croatia | 0.2 /100 | #276 | Tragic 51.8% |
| Immigrants | Africa | 0.2 /100 | #277 | Tragic 51.8% |
| Yuman | 0.1 /100 | #278 | Tragic 51.7% |
| Liberians | 0.1 /100 | #279 | Tragic 51.7% |
| Immigrants | Eastern Europe | 0.1 /100 | #280 | Tragic 51.7% |
Demographics Similar to Lithuanians by 2 or more Vehicles in Household
In terms of 2 or more vehicles in household, the demographic groups most similar to Lithuanians are Slovene (58.3%, a difference of 0.050%), Creek (58.3%, a difference of 0.060%), Delaware (58.2%, a difference of 0.080%), Polish (58.3%, a difference of 0.10%), and Immigrants from Afghanistan (58.3%, a difference of 0.17%).
| Demographics | Rating | Rank | 2 or more Vehicles in Household |
| Bangladeshis | 99.6 /100 | #71 | Exceptional 58.4% |
| Austrians | 99.6 /100 | #72 | Exceptional 58.4% |
| Bolivians | 99.6 /100 | #73 | Exceptional 58.3% |
| Immigrants | Afghanistan | 99.6 /100 | #74 | Exceptional 58.3% |
| Poles | 99.5 /100 | #75 | Exceptional 58.3% |
| Creek | 99.5 /100 | #76 | Exceptional 58.3% |
| Slovenes | 99.5 /100 | #77 | Exceptional 58.3% |
| Lithuanians | 99.5 /100 | #78 | Exceptional 58.2% |
| Delaware | 99.4 /100 | #79 | Exceptional 58.2% |
| Immigrants | England | 99.3 /100 | #80 | Exceptional 58.1% |
| Immigrants | Iraq | 99.3 /100 | #81 | Exceptional 58.1% |
| Iranians | 99.3 /100 | #82 | Exceptional 58.1% |
| Icelanders | 99.2 /100 | #83 | Exceptional 58.0% |
| Maltese | 99.2 /100 | #84 | Exceptional 58.0% |
| Slovaks | 99.2 /100 | #85 | Exceptional 58.0% |