Israeli vs Finnish In Labor Force | Age > 16
COMPARE
Israeli
Finnish
In Labor Force | Age > 16
In Labor Force | Age > 16 Comparison
Israelis
Finns
65.2%
IN LABOR FORCE | AGE > 16
61.6/ 100
METRIC RATING
171st/ 347
METRIC RANK
64.2%
IN LABOR FORCE | AGE > 16
0.7/ 100
METRIC RATING
262nd/ 347
METRIC RANK
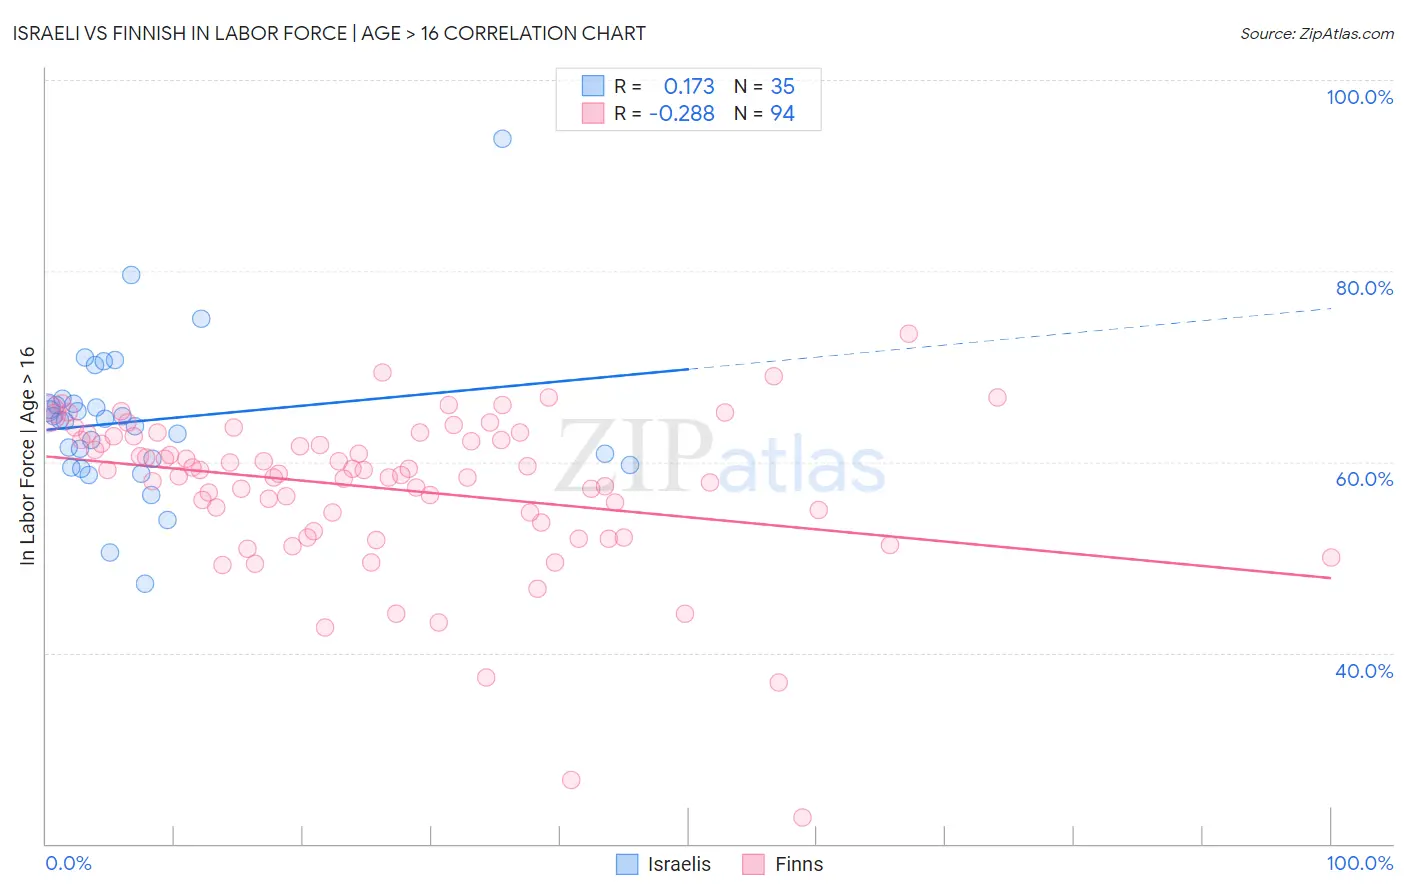
Israeli vs Finnish In Labor Force | Age > 16 Correlation Chart
The statistical analysis conducted on geographies consisting of 211,218,768 people shows a poor positive correlation between the proportion of Israelis and labor force participation rate among population ages 16 and over in the United States with a correlation coefficient (R) of 0.173 and weighted average of 65.2%. Similarly, the statistical analysis conducted on geographies consisting of 404,683,766 people shows a weak negative correlation between the proportion of Finns and labor force participation rate among population ages 16 and over in the United States with a correlation coefficient (R) of -0.288 and weighted average of 64.2%, a difference of 1.6%.
In Labor Force | Age > 16 Correlation Summary
| Measurement | Israeli | Finnish |
| Minimum | 47.2% | 22.7% |
| Maximum | 93.8% | 73.4% |
| Range | 46.6% | 50.7% |
| Mean | 64.3% | 57.2% |
| Median | 64.4% | 58.9% |
| Interquartile 25% (IQ1) | 59.7% | 53.6% |
| Interquartile 75% (IQ3) | 66.1% | 62.7% |
| Interquartile Range (IQR) | 6.4% | 9.1% |
| Standard Deviation (Sample) | 8.1% | 8.3% |
| Standard Deviation (Population) | 8.0% | 8.2% |
Similar Demographics by In Labor Force | Age > 16
Demographics Similar to Israelis by In Labor Force | Age > 16
In terms of in labor force | age > 16, the demographic groups most similar to Israelis are Immigrants from Israel (65.2%, a difference of 0.0%), Immigrants from Sweden (65.2%, a difference of 0.0%), Arab (65.2%, a difference of 0.010%), Serbian (65.2%, a difference of 0.020%), and Immigrants from Belarus (65.2%, a difference of 0.050%).
| Demographics | Rating | Rank | In Labor Force | Age > 16 |
| Danes | 68.8 /100 | #164 | Good 65.3% |
| Immigrants | Kazakhstan | 68.1 /100 | #165 | Good 65.3% |
| Immigrants | Western Asia | 67.3 /100 | #166 | Good 65.3% |
| Immigrants | Belarus | 66.0 /100 | #167 | Good 65.2% |
| Serbians | 63.5 /100 | #168 | Good 65.2% |
| Arabs | 62.4 /100 | #169 | Good 65.2% |
| Immigrants | Israel | 61.7 /100 | #170 | Good 65.2% |
| Israelis | 61.6 /100 | #171 | Good 65.2% |
| Immigrants | Sweden | 61.3 /100 | #172 | Good 65.2% |
| Immigrants | Ukraine | 53.7 /100 | #173 | Average 65.1% |
| Macedonians | 50.0 /100 | #174 | Average 65.1% |
| Nicaraguans | 49.7 /100 | #175 | Average 65.1% |
| Swedes | 47.4 /100 | #176 | Average 65.1% |
| Eastern Europeans | 46.2 /100 | #177 | Average 65.1% |
| Trinidadians and Tobagonians | 45.2 /100 | #178 | Average 65.1% |
Demographics Similar to Finns by In Labor Force | Age > 16
In terms of in labor force | age > 16, the demographic groups most similar to Finns are Marshallese (64.2%, a difference of 0.010%), Basque (64.2%, a difference of 0.010%), Bahamian (64.2%, a difference of 0.010%), Immigrants from Western Europe (64.2%, a difference of 0.020%), and Dutch (64.2%, a difference of 0.030%).
| Demographics | Rating | Rank | In Labor Force | Age > 16 |
| Hispanics or Latinos | 1.1 /100 | #255 | Tragic 64.3% |
| Immigrants | Mexico | 1.0 /100 | #256 | Tragic 64.3% |
| Inupiat | 0.8 /100 | #257 | Tragic 64.3% |
| Immigrants | Scotland | 0.8 /100 | #258 | Tragic 64.2% |
| Immigrants | Western Europe | 0.7 /100 | #259 | Tragic 64.2% |
| Marshallese | 0.7 /100 | #260 | Tragic 64.2% |
| Basques | 0.7 /100 | #261 | Tragic 64.2% |
| Finns | 0.7 /100 | #262 | Tragic 64.2% |
| Bahamians | 0.6 /100 | #263 | Tragic 64.2% |
| Dutch | 0.6 /100 | #264 | Tragic 64.2% |
| Cubans | 0.5 /100 | #265 | Tragic 64.2% |
| Immigrants | England | 0.5 /100 | #266 | Tragic 64.2% |
| Canadians | 0.5 /100 | #267 | Tragic 64.1% |
| Spaniards | 0.5 /100 | #268 | Tragic 64.1% |
| Irish | 0.4 /100 | #269 | Tragic 64.1% |