Israeli vs Finnish Seniors Poverty Over the Age of 75
COMPARE
Israeli
Finnish
Seniors Poverty Over the Age of 75
Seniors Poverty Over the Age of 75 Comparison
Israelis
Finns
13.2%
SENIORS POVERTY OVER THE AGE OF 75
2.0/ 100
METRIC RATING
228th/ 347
METRIC RANK
10.8%
SENIORS POVERTY OVER THE AGE OF 75
99.6/ 100
METRIC RATING
38th/ 347
METRIC RANK
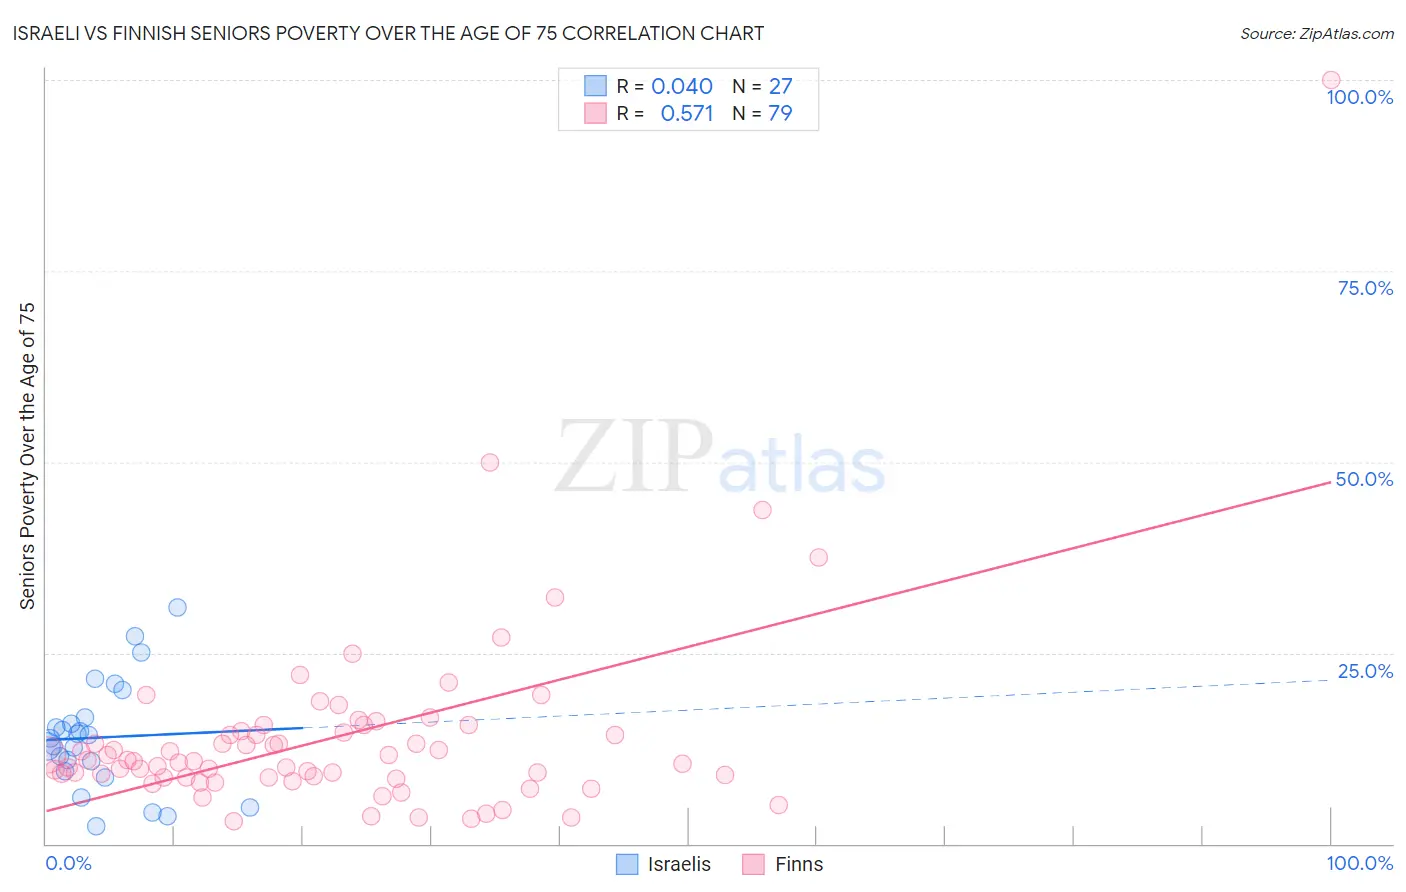
Israeli vs Finnish Seniors Poverty Over the Age of 75 Correlation Chart
The statistical analysis conducted on geographies consisting of 209,472,862 people shows no correlation between the proportion of Israelis and poverty level among seniors over the age of 75 in the United States with a correlation coefficient (R) of 0.040 and weighted average of 13.2%. Similarly, the statistical analysis conducted on geographies consisting of 398,908,643 people shows a substantial positive correlation between the proportion of Finns and poverty level among seniors over the age of 75 in the United States with a correlation coefficient (R) of 0.571 and weighted average of 10.8%, a difference of 21.4%.
Seniors Poverty Over the Age of 75 Correlation Summary
| Measurement | Israeli | Finnish |
| Minimum | 2.3% | 2.9% |
| Maximum | 30.9% | 100.0% |
| Range | 28.6% | 97.1% |
| Mean | 13.9% | 13.9% |
| Median | 13.8% | 10.8% |
| Interquartile 25% (IQ1) | 9.5% | 8.6% |
| Interquartile 75% (IQ3) | 16.5% | 14.6% |
| Interquartile Range (IQR) | 7.0% | 6.0% |
| Standard Deviation (Sample) | 7.1% | 12.8% |
| Standard Deviation (Population) | 6.9% | 12.7% |
Similar Demographics by Seniors Poverty Over the Age of 75
Demographics Similar to Israelis by Seniors Poverty Over the Age of 75
In terms of seniors poverty over the age of 75, the demographic groups most similar to Israelis are Cree (13.1%, a difference of 0.28%), Somali (13.2%, a difference of 0.44%), Immigrants from China (13.2%, a difference of 0.52%), Subsaharan African (13.2%, a difference of 0.53%), and Shoshone (13.1%, a difference of 0.55%).
| Demographics | Rating | Rank | Seniors Poverty Over the Age of 75 |
| Immigrants | Kazakhstan | 4.3 /100 | #221 | Tragic 13.0% |
| Nigerians | 3.4 /100 | #222 | Tragic 13.0% |
| Immigrants | Nigeria | 3.3 /100 | #223 | Tragic 13.0% |
| Chippewa | 2.9 /100 | #224 | Tragic 13.1% |
| Immigrants | Morocco | 2.8 /100 | #225 | Tragic 13.1% |
| Shoshone | 2.6 /100 | #226 | Tragic 13.1% |
| Cree | 2.3 /100 | #227 | Tragic 13.1% |
| Israelis | 2.0 /100 | #228 | Tragic 13.2% |
| Somalis | 1.6 /100 | #229 | Tragic 13.2% |
| Immigrants | China | 1.5 /100 | #230 | Tragic 13.2% |
| Sub-Saharan Africans | 1.5 /100 | #231 | Tragic 13.2% |
| Immigrants | Chile | 1.3 /100 | #232 | Tragic 13.3% |
| Immigrants | Costa Rica | 1.3 /100 | #233 | Tragic 13.3% |
| Immigrants | Israel | 1.1 /100 | #234 | Tragic 13.3% |
| Japanese | 0.9 /100 | #235 | Tragic 13.3% |
Demographics Similar to Finns by Seniors Poverty Over the Age of 75
In terms of seniors poverty over the age of 75, the demographic groups most similar to Finns are Latvian (10.8%, a difference of 0.14%), Scotch-Irish (10.8%, a difference of 0.30%), Luxembourger (10.8%, a difference of 0.35%), Czechoslovakian (10.9%, a difference of 0.62%), and Italian (10.8%, a difference of 0.74%).
| Demographics | Rating | Rank | Seniors Poverty Over the Age of 75 |
| Marshallese | 99.7 /100 | #31 | Exceptional 10.7% |
| British | 99.7 /100 | #32 | Exceptional 10.7% |
| Puget Sound Salish | 99.7 /100 | #33 | Exceptional 10.8% |
| Italians | 99.7 /100 | #34 | Exceptional 10.8% |
| Luxembourgers | 99.6 /100 | #35 | Exceptional 10.8% |
| Scotch-Irish | 99.6 /100 | #36 | Exceptional 10.8% |
| Latvians | 99.6 /100 | #37 | Exceptional 10.8% |
| Finns | 99.6 /100 | #38 | Exceptional 10.8% |
| Czechoslovakians | 99.4 /100 | #39 | Exceptional 10.9% |
| Thais | 99.4 /100 | #40 | Exceptional 10.9% |
| Immigrants | Lithuania | 99.2 /100 | #41 | Exceptional 11.0% |
| Austrians | 99.1 /100 | #42 | Exceptional 11.0% |
| Celtics | 99.1 /100 | #43 | Exceptional 11.0% |
| Belgians | 99.1 /100 | #44 | Exceptional 11.0% |
| Carpatho Rusyns | 99.0 /100 | #45 | Exceptional 11.1% |