Iroquois vs Immigrants from Chile Householder Income Over 65 years
COMPARE
Iroquois
Immigrants from Chile
Householder Income Over 65 years
Householder Income Over 65 years Comparison
Iroquois
Immigrants from Chile
$53,737
HOUSEHOLDER INCOME OVER 65 YEARS
0.1/ 100
METRIC RATING
289th/ 347
METRIC RANK
$62,354
HOUSEHOLDER INCOME OVER 65 YEARS
81.0/ 100
METRIC RATING
135th/ 347
METRIC RANK
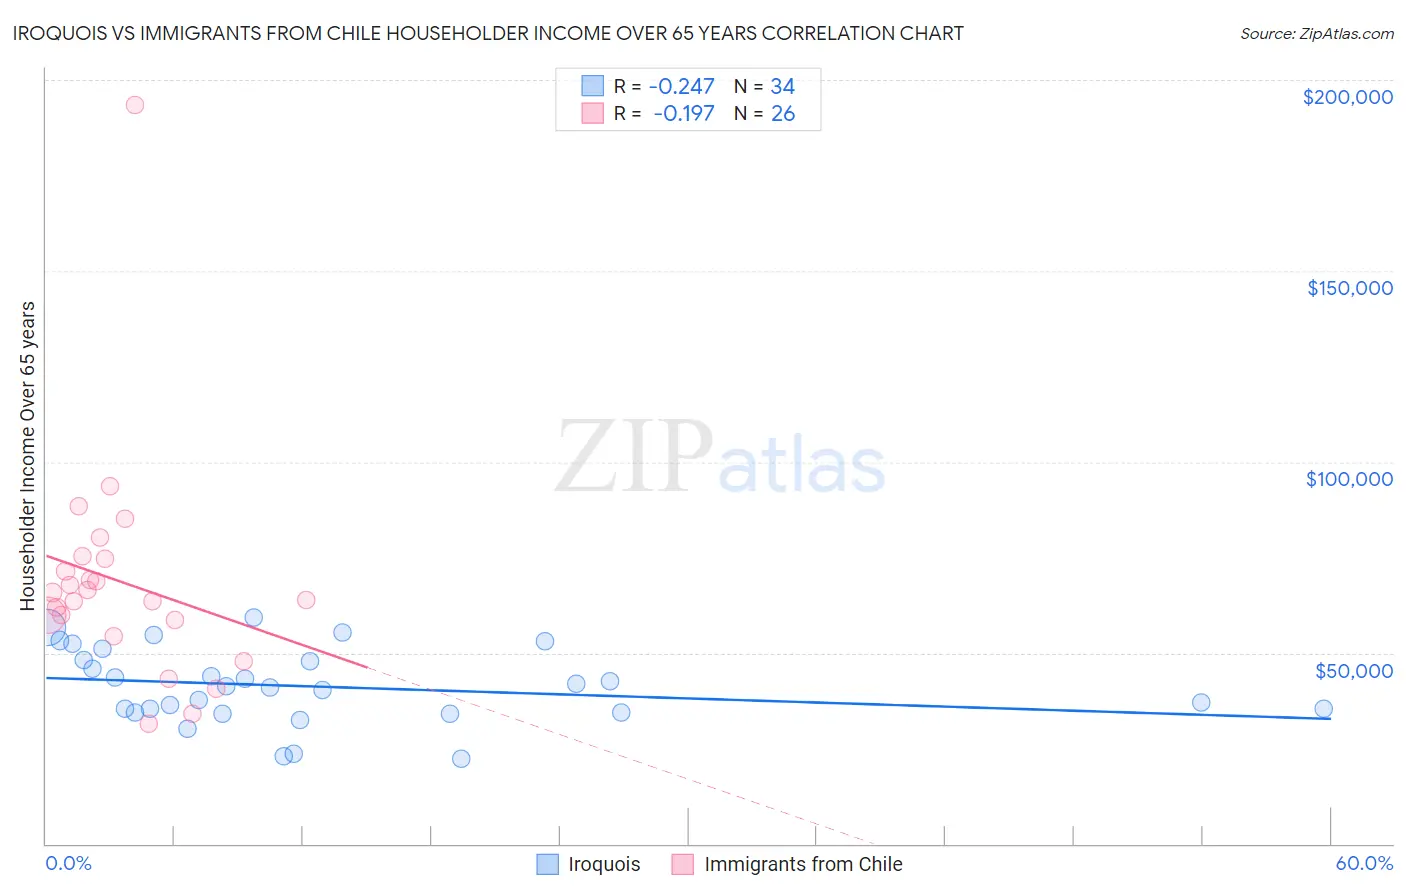
Iroquois vs Immigrants from Chile Householder Income Over 65 years Correlation Chart
The statistical analysis conducted on geographies consisting of 206,830,612 people shows a weak negative correlation between the proportion of Iroquois and household income with householder over the age of 65 in the United States with a correlation coefficient (R) of -0.247 and weighted average of $53,737. Similarly, the statistical analysis conducted on geographies consisting of 218,471,340 people shows a poor negative correlation between the proportion of Immigrants from Chile and household income with householder over the age of 65 in the United States with a correlation coefficient (R) of -0.197 and weighted average of $62,354, a difference of 16.0%.
Householder Income Over 65 years Correlation Summary
| Measurement | Iroquois | Immigrants from Chile |
| Minimum | $22,212 | $31,406 |
| Maximum | $59,317 | $193,611 |
| Range | $37,105 | $162,205 |
| Mean | $41,171 | $68,575 |
| Median | $40,975 | $64,728 |
| Interquartile 25% (IQ1) | $34,309 | $58,558 |
| Interquartile 75% (IQ3) | $48,128 | $74,792 |
| Interquartile Range (IQR) | $13,819 | $16,234 |
| Standard Deviation (Sample) | $9,770 | $29,777 |
| Standard Deviation (Population) | $9,625 | $29,198 |
Similar Demographics by Householder Income Over 65 years
Demographics Similar to Iroquois by Householder Income Over 65 years
In terms of householder income over 65 years, the demographic groups most similar to Iroquois are Chickasaw ($53,732, a difference of 0.010%), Immigrants from Barbados ($53,766, a difference of 0.050%), Paiute ($53,762, a difference of 0.050%), African ($53,711, a difference of 0.050%), and Shoshone ($53,681, a difference of 0.10%).
| Demographics | Rating | Rank | Householder Income Over 65 years |
| Immigrants | Armenia | 0.1 /100 | #282 | Tragic $53,974 |
| Immigrants | Liberia | 0.1 /100 | #283 | Tragic $53,967 |
| Immigrants | Guatemala | 0.1 /100 | #284 | Tragic $53,950 |
| Mexicans | 0.1 /100 | #285 | Tragic $53,897 |
| Chippewa | 0.1 /100 | #286 | Tragic $53,847 |
| Immigrants | Barbados | 0.1 /100 | #287 | Tragic $53,766 |
| Paiute | 0.1 /100 | #288 | Tragic $53,762 |
| Iroquois | 0.1 /100 | #289 | Tragic $53,737 |
| Chickasaw | 0.1 /100 | #290 | Tragic $53,732 |
| Africans | 0.0 /100 | #291 | Tragic $53,711 |
| Shoshone | 0.0 /100 | #292 | Tragic $53,681 |
| Immigrants | Belize | 0.0 /100 | #293 | Tragic $53,665 |
| Senegalese | 0.0 /100 | #294 | Tragic $53,591 |
| Immigrants | Central America | 0.0 /100 | #295 | Tragic $53,420 |
| Immigrants | Somalia | 0.0 /100 | #296 | Tragic $53,333 |
Demographics Similar to Immigrants from Chile by Householder Income Over 65 years
In terms of householder income over 65 years, the demographic groups most similar to Immigrants from Chile are Immigrants from Brazil ($62,364, a difference of 0.020%), Alaskan Athabascan ($62,330, a difference of 0.040%), Immigrants from Syria ($62,303, a difference of 0.080%), Immigrants from Kazakhstan ($62,292, a difference of 0.10%), and Lebanese ($62,287, a difference of 0.11%).
| Demographics | Rating | Rank | Householder Income Over 65 years |
| Aleuts | 86.1 /100 | #128 | Excellent $62,708 |
| Immigrants | Eastern Europe | 85.9 /100 | #129 | Excellent $62,693 |
| Basques | 85.4 /100 | #130 | Excellent $62,653 |
| Immigrants | Western Asia | 85.3 /100 | #131 | Excellent $62,645 |
| Immigrants | Germany | 83.9 /100 | #132 | Excellent $62,544 |
| Immigrants | Northern Africa | 83.6 /100 | #133 | Excellent $62,522 |
| Immigrants | Brazil | 81.2 /100 | #134 | Excellent $62,364 |
| Immigrants | Chile | 81.0 /100 | #135 | Excellent $62,354 |
| Alaskan Athabascans | 80.6 /100 | #136 | Excellent $62,330 |
| Immigrants | Syria | 80.2 /100 | #137 | Excellent $62,303 |
| Immigrants | Kazakhstan | 80.0 /100 | #138 | Excellent $62,292 |
| Lebanese | 79.9 /100 | #139 | Good $62,287 |
| Arabs | 79.6 /100 | #140 | Good $62,266 |
| Canadians | 79.0 /100 | #141 | Good $62,230 |
| South American Indians | 78.7 /100 | #142 | Good $62,215 |