Iroquois vs Iranian 2 or more Vehicles in Household
COMPARE
Iroquois
Iranian
2 or more Vehicles in Household
2 or more Vehicles in Household Comparison
Iroquois
Iranians
54.7%
2 OR MORE VEHICLES IN HOUSEHOLD
22.6/ 100
METRIC RATING
195th/ 347
METRIC RANK
58.1%
2 OR MORE VEHICLES IN HOUSEHOLD
99.3/ 100
METRIC RATING
82nd/ 347
METRIC RANK
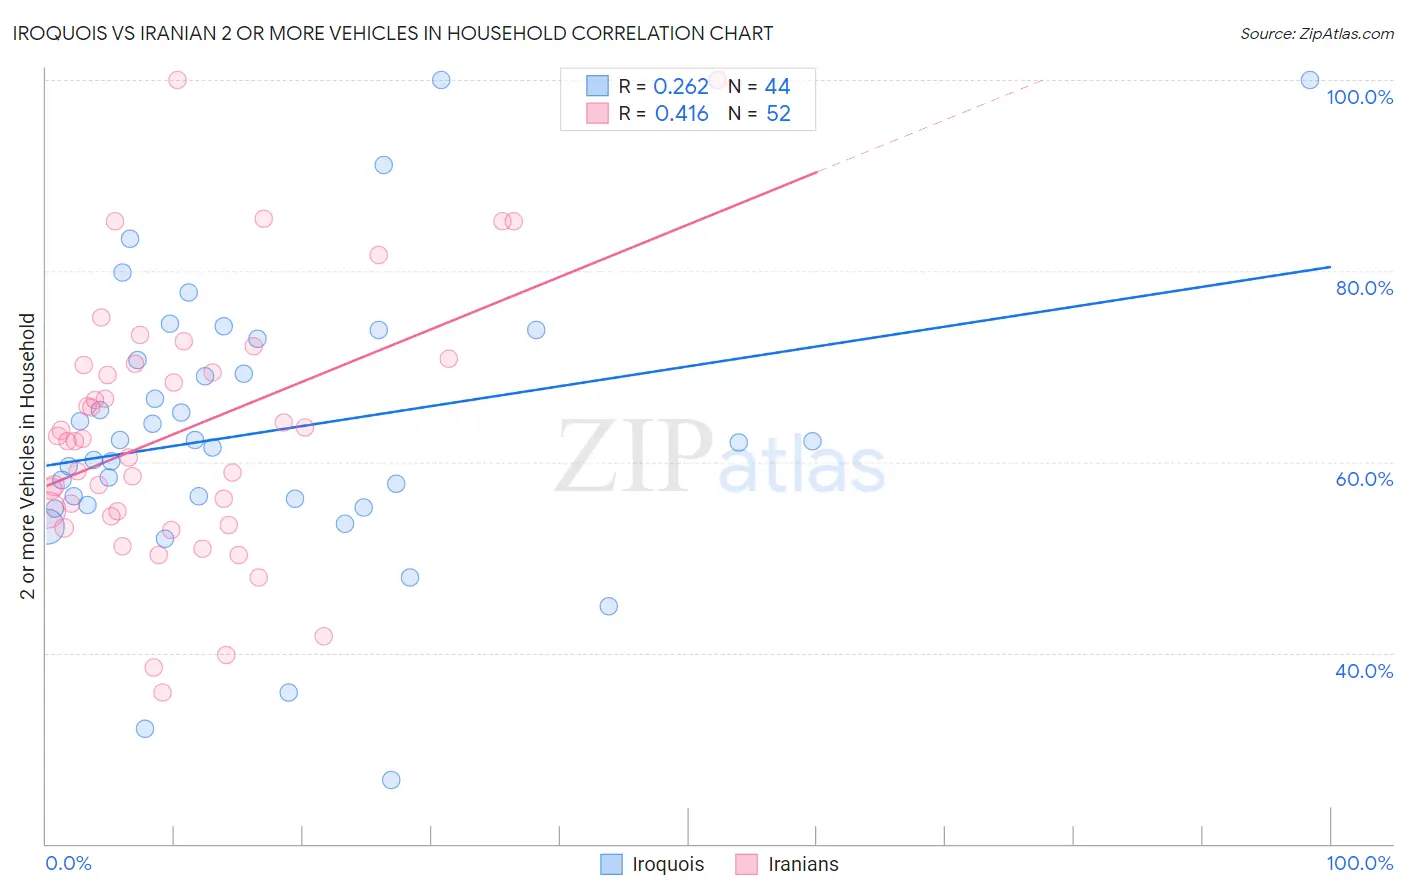
Iroquois vs Iranian 2 or more Vehicles in Household Correlation Chart
The statistical analysis conducted on geographies consisting of 207,258,342 people shows a weak positive correlation between the proportion of Iroquois and percentage of households with 2 or more vehicles available in the United States with a correlation coefficient (R) of 0.262 and weighted average of 54.7%. Similarly, the statistical analysis conducted on geographies consisting of 316,668,802 people shows a moderate positive correlation between the proportion of Iranians and percentage of households with 2 or more vehicles available in the United States with a correlation coefficient (R) of 0.416 and weighted average of 58.1%, a difference of 6.2%.
2 or more Vehicles in Household Correlation Summary
| Measurement | Iroquois | Iranian |
| Minimum | 26.7% | 35.8% |
| Maximum | 100.0% | 100.0% |
| Range | 73.3% | 64.2% |
| Mean | 63.2% | 63.3% |
| Median | 62.1% | 62.3% |
| Interquartile 25% (IQ1) | 55.8% | 54.6% |
| Interquartile 75% (IQ3) | 71.8% | 70.2% |
| Interquartile Range (IQR) | 16.0% | 15.7% |
| Standard Deviation (Sample) | 14.9% | 13.8% |
| Standard Deviation (Population) | 14.7% | 13.7% |
Similar Demographics by 2 or more Vehicles in Household
Demographics Similar to Iroquois by 2 or more Vehicles in Household
In terms of 2 or more vehicles in household, the demographic groups most similar to Iroquois are Central American (54.7%, a difference of 0.030%), Immigrants from Japan (54.7%, a difference of 0.050%), Immigrants from Romania (54.7%, a difference of 0.070%), Immigrants (54.7%, a difference of 0.13%), and Russian (54.8%, a difference of 0.20%).
| Demographics | Rating | Rank | 2 or more Vehicles in Household |
| Marshallese | 30.5 /100 | #188 | Fair 54.9% |
| Eastern Europeans | 27.5 /100 | #189 | Fair 54.8% |
| Russians | 26.3 /100 | #190 | Fair 54.8% |
| Immigrants | Immigrants | 25.0 /100 | #191 | Fair 54.7% |
| Immigrants | Romania | 23.8 /100 | #192 | Fair 54.7% |
| Immigrants | Japan | 23.4 /100 | #193 | Fair 54.7% |
| Central Americans | 23.0 /100 | #194 | Fair 54.7% |
| Iroquois | 22.6 /100 | #195 | Fair 54.7% |
| Immigrants | Poland | 19.3 /100 | #196 | Poor 54.6% |
| Argentineans | 17.5 /100 | #197 | Poor 54.5% |
| Carpatho Rusyns | 16.2 /100 | #198 | Poor 54.4% |
| Immigrants | Norway | 15.9 /100 | #199 | Poor 54.4% |
| Houma | 15.8 /100 | #200 | Poor 54.4% |
| Immigrants | Italy | 15.5 /100 | #201 | Poor 54.4% |
| Immigrants | North Macedonia | 14.9 /100 | #202 | Poor 54.4% |
Demographics Similar to Iranians by 2 or more Vehicles in Household
In terms of 2 or more vehicles in household, the demographic groups most similar to Iranians are Icelander (58.0%, a difference of 0.040%), Maltese (58.0%, a difference of 0.070%), Immigrants from Iraq (58.1%, a difference of 0.080%), Immigrants from England (58.1%, a difference of 0.10%), and Slovak (58.0%, a difference of 0.13%).
| Demographics | Rating | Rank | 2 or more Vehicles in Household |
| Poles | 99.5 /100 | #75 | Exceptional 58.3% |
| Creek | 99.5 /100 | #76 | Exceptional 58.3% |
| Slovenes | 99.5 /100 | #77 | Exceptional 58.3% |
| Lithuanians | 99.5 /100 | #78 | Exceptional 58.2% |
| Delaware | 99.4 /100 | #79 | Exceptional 58.2% |
| Immigrants | England | 99.3 /100 | #80 | Exceptional 58.1% |
| Immigrants | Iraq | 99.3 /100 | #81 | Exceptional 58.1% |
| Iranians | 99.3 /100 | #82 | Exceptional 58.1% |
| Icelanders | 99.2 /100 | #83 | Exceptional 58.0% |
| Maltese | 99.2 /100 | #84 | Exceptional 58.0% |
| Slovaks | 99.2 /100 | #85 | Exceptional 58.0% |
| Potawatomi | 99.1 /100 | #86 | Exceptional 58.0% |
| Thais | 99.1 /100 | #87 | Exceptional 57.9% |
| Immigrants | Iran | 99.1 /100 | #88 | Exceptional 57.9% |
| Immigrants | Germany | 99.0 /100 | #89 | Exceptional 57.9% |